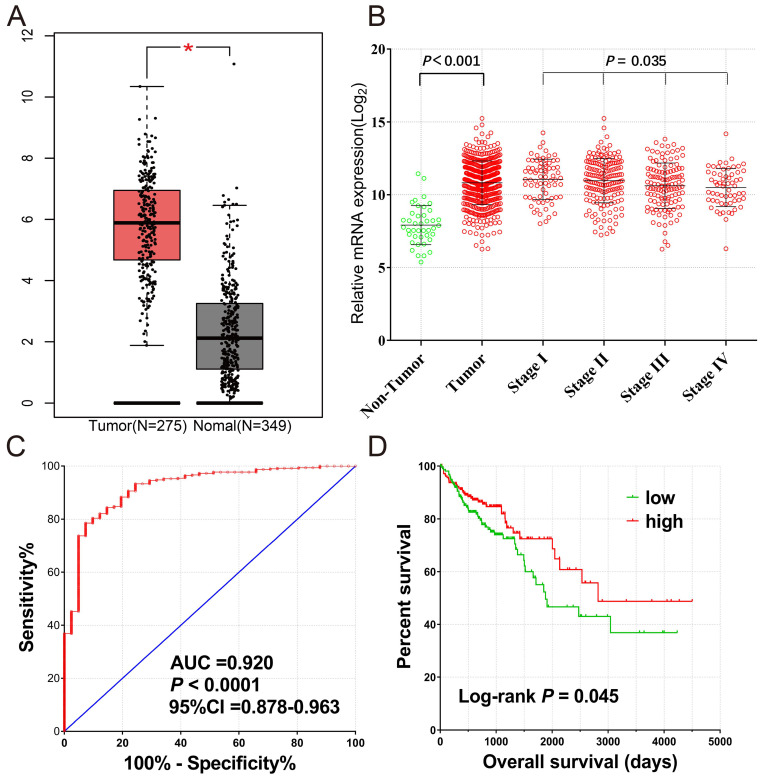
Figure 2.
(A) The mRNA expression levels of CXCL1 gene comparison in normal colon tissue and primary colon tumors based on TCGA and GTEx database; (B) The Scatter plot of CXCL1 gene mRNA expression in tumor tissues and paracancerous non-tumor colon tissues of TCGA cohort, as well as those of different tumor stages; (C) The ROC curves of CXCL1 gene mRNA expression in tumor tissues and paracancerous non-tumor colon tissues of TCGA cohort; (D) Kaplan-Meier curves for CXCL1 gene in COAD of TCGA cohort.

