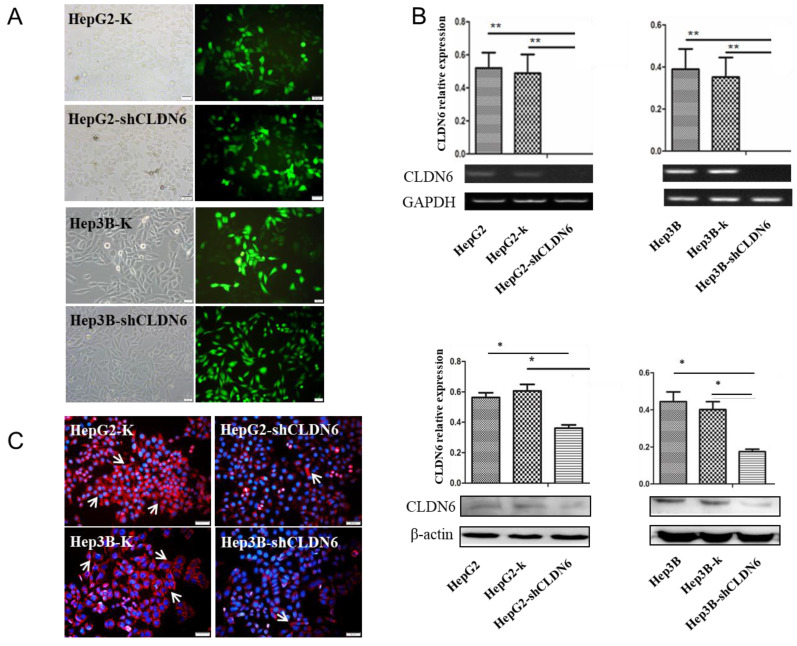
Figure 2.
The silencing of CLDN6 in hHCC cells HepG2 and Hep3B. A, GFP efficiency of HepG2 and Hep3B cells after silencing of CLDN6. B, RT-PCR and western blot results for the expression of CLDN6 in HepG2 and Hep3B cells. C, Immunofluorescence of CLDN6 expression and location in HepG2 and Hep3B cells, the white arrows point out typical cells that express CLDN6. (bar, 20 μm; *, p < 0.05; **, p < 0.01).

