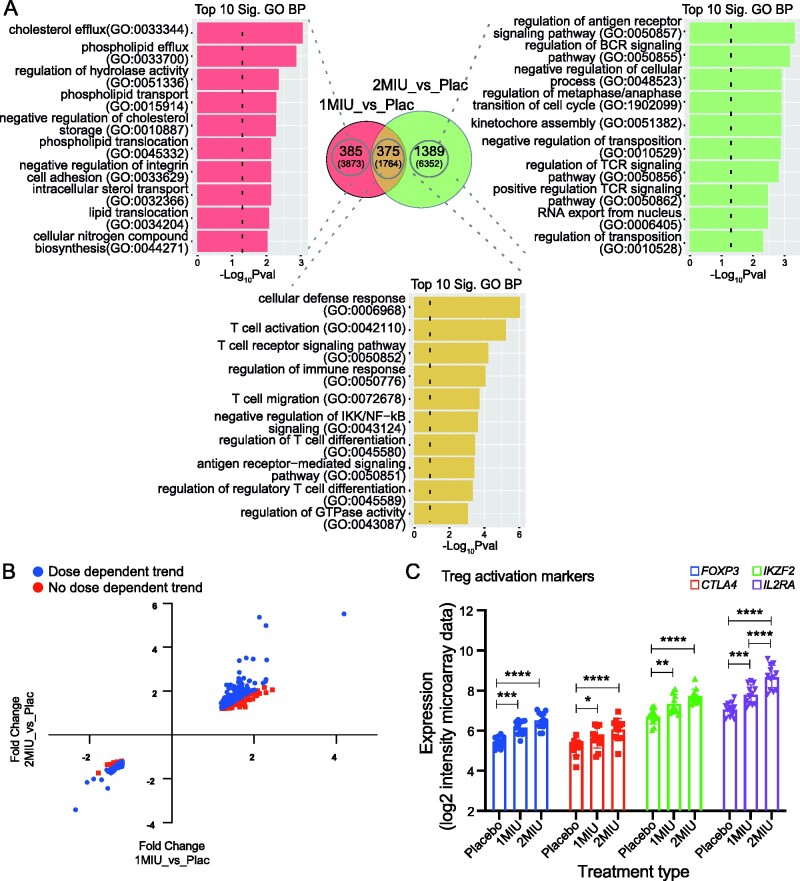
Figure 1.
End of the treatment (D64) analysis and dose-dependency.(A) Venn diagram showing significant (P-value <0.05) differentially expressed genes (DEGs) from either 1MIU_vs_Placebo or 2MIU_vs_Placebo TAC (Transcriptome analysis console) comparisons. All altered transcripts are reported in brackets while RefSeq annotated transcripts are shown in bold. Overlapping common DEGs are also shown. For each RefSeq transcript list shown in the Venn diagram, the top 10 significant enriched Gene Ontology (GO) biological processes are plotted. X-axis: −Log10 (enrichment P-value); y-axis: GO term. (B) Scatter plot displaying 375 RefSeq DEGs altered in common within the two treatment groups and their fold changes resulting from either 1MIU_vs_Placebo (X-axis) or 2MIU_vs_Placebo (Y-axis) comparisons. 260 out of 375 genes (69.3%) show a dose-dependent expression (in blue) while transcripts showing no dose-dependent trend are represented in red. (C) The expression levels (SST-RMA normalized log2 of signal intensity from the microarrays) of 4 Treg activation markers—FOXP3, CTLA4, IKZF2 and IL2RA—are shown. A significant dose-dependent upregulation of these transcripts is detected. Box plots show mean ± SD. A two-way ANOVA with Tukey's correction for multiple comparisons was conducted. *: Adjusted P-value < 0.05, **: Adjusted P-value < 0.01, ***: Adjusted P-value < 0.001, ****: Adjusted P-value < 0.0001. SST-RMA, signal space transformation robust multi-chip analysis method for microarray data normalization.

