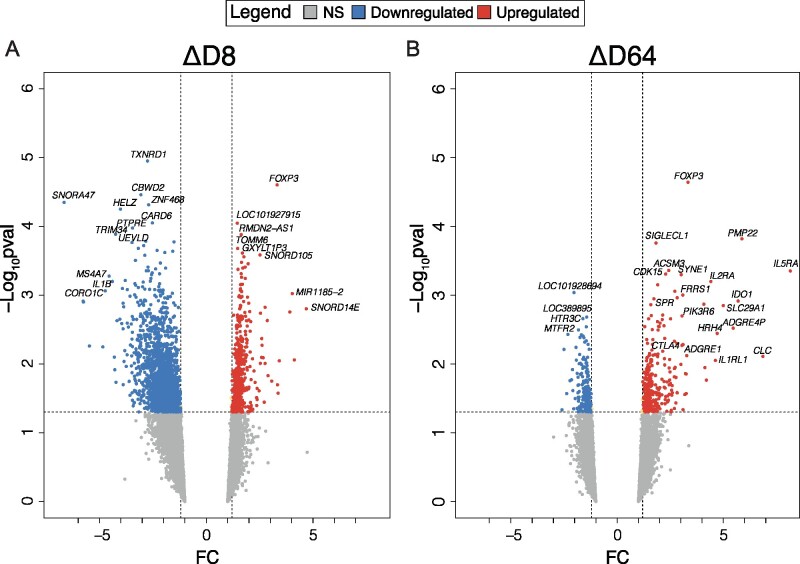
Figure 2.
Transcriptional changes during 2MIU-IL2 administration. Volcano plots displaying differentially expressed genes (DEGs) resulting from the comparisons ΔD8 (A) and ΔD64 (B). DEGs are plotted and colour-coded depending on their fold change (FC) and their significance levels (−Log10P-value): non-significant or transcripts that failed the FC cut-off are reported in grey, significant and with FC ≤−1.2 in blue and significant and with FC ≥1.2 in red. Three black lines are also shown: the horizontal line indicates the significance threshold (−Log10P-value = 1.3) and two vertical dotted lines mark the FC cut-off at −1.2 and 1.2, respectively. A widespread downregulation is detectable at D8, while at D64 an increased upregulation is reported amongst which some Treg makers are recognizable (Empirical Bayesian statistics was conducted using Limma to find significant DEGs).

