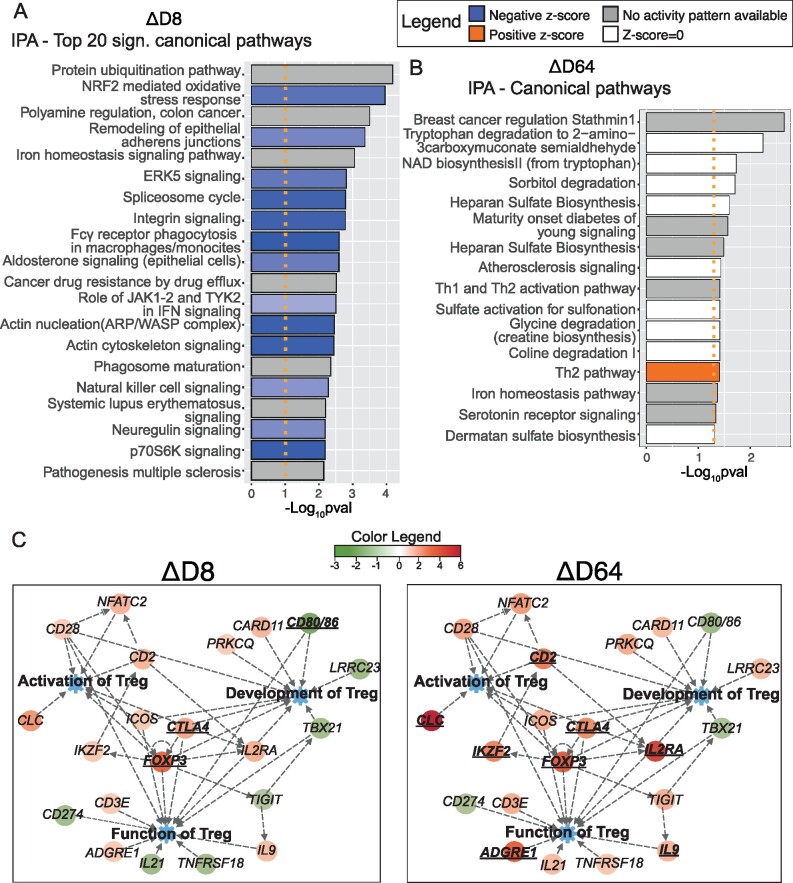
Figure 4.
Ingenuity Pathway Analysis (IPA). Bar plots displaying top 20 significant IPA canonical pathways. Activated (z-score > 0, in orange) or inhibited pathways (z-score < 0, in blue) resulting from the analysis ΔD8 (A) and ΔD64 (B) are shown. Significant pathways but with z-score equal to 0 (in white) or with no activation prediction available in the software (in grey) are also reported. A significance threshold line is displayed in orange (−Log10P-value = 1.3). A widespread downregulation of inflammatory pathways is detectable at D8 while fewer pathways are altered at D64. However, activation of Th2 is reported (A right-tailed Fisher’s Exact test was conducted to calculate significantly altered pathways and the z-score was computed to predict the activation state of each mechanism). (C) Customized pathways created with IPA displaying key regulators of activation, development and functions of Tregs. In particular, two pathway maps displaying fold changes (FCs) from ΔD8 and ΔD64 are juxtaposed for comparison. Significant (P-value < 0.05) differentially expressed genes are shown in bold and their gene symbol is underlined. A more prominent upregulation of Treg genes is reported at D64. Data were analysed through the use of IPA (QIAGEN Inc., https://www.qiagenbioinformatics.com/products/ingenuitypathway-analysis).

