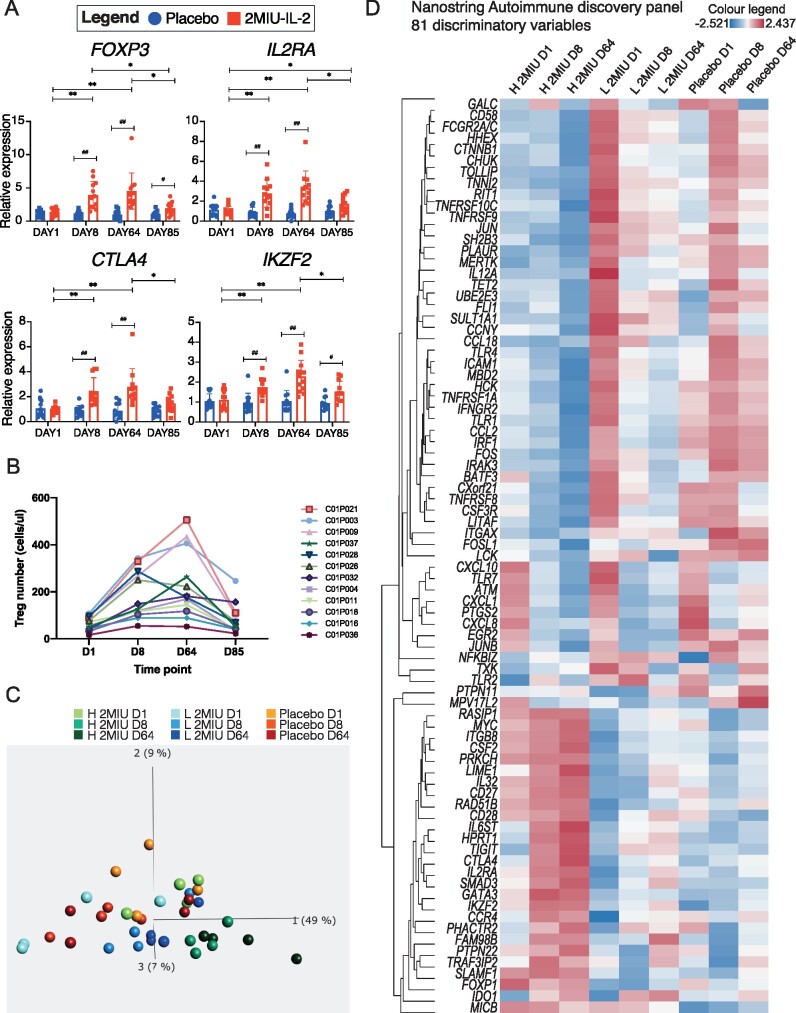
Figure 6.
Microarray validation and patient variability. (A) Graphs showing expression of FOXP3, IL2RA, CTLA4 and IKZF2 in 2MIU-IL-2 treated (in red) and placebo (in blue) patients at the four different time points (D1, D8, D64 and D85). Data were generated through qRT-PCR. A time-dependent activation of these markers is reported in the ld-IL-2 group. Box plots display mean SD (technical replicates = 3). A two-way ANOVA with either Sidak (for comparisons between different treatment regimens, significant differences indicated with *) or Tukey (for comparisons between time points within the same treatment type, significant differences indicated with #) correction for multiple comparisons was conducted. * or #: Adjusted P-value <0.05, ** or ##: Adjusted P-value <0.01. (B) Graph displaying the number of Tregs per μl of blood of each 2MIU IL-2-treated participant at each time point (Flow-cytometry data). Patients are shown with different colours and their IDs are reported in the legend (C) PCA plot summarizing expression differences between samples depending on treatment regimen and time point (colour code legend is reported. H 2MIU D1, D8, D64 = high-Treg-responders at D1, D8 and D64; L 2MIU D1, D8, D64 = low-Treg-responders at D1, D8 and D64 and Placebo at D1, D8 and D64). High-Treg-responders from D8 and D64 are the most different samples. (Qlucore multi group comparison statistical test, P-value <0.05) (D) Hierarchically clustered heatmap displaying differences in the expression of 81 transcripts identified as discriminating variables from the PCA analysis in Fig. B. Gene expression variations across sample groups (H 2MIU D1, D8, D64 = high-Treg-responders at D1, D8 and D64; L 2MIU D1, D8, D64= low-Treg-responders at D1, D8 and D64 and Placebo at D1, D8 and D64) are displayed as z-scores (positive z-scores in red, negative in blue). An opposite expression between high and low-Treg-responders is detectable, especially at D1.

