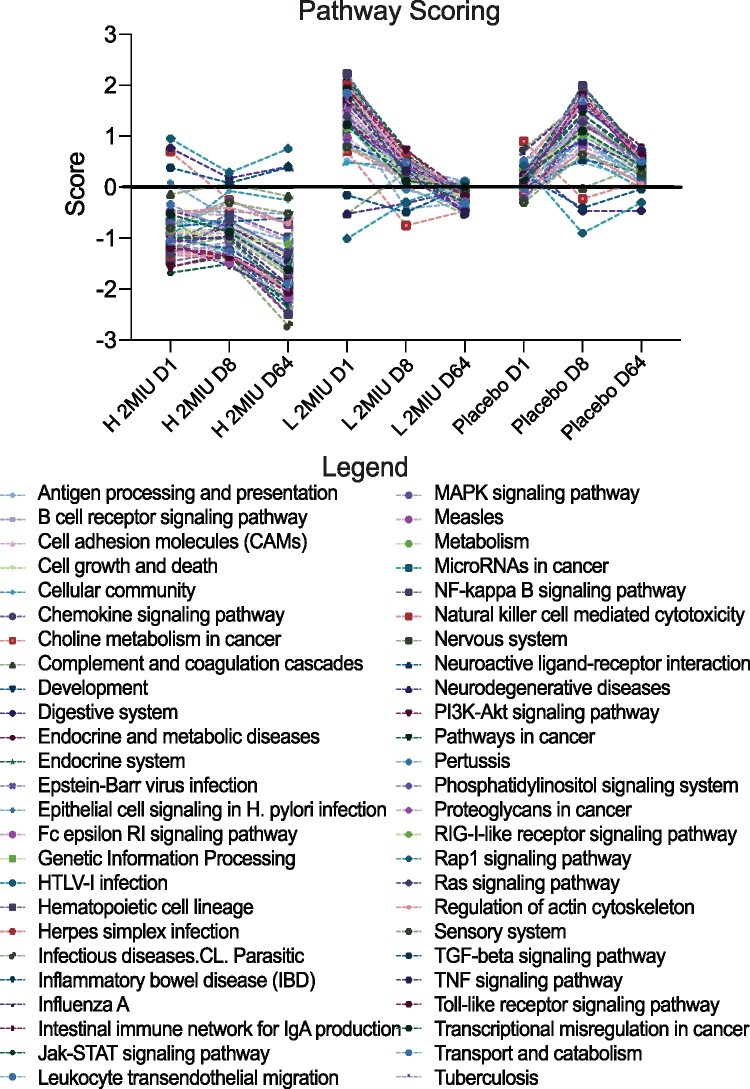
Figure 7.
Pathway scoring analysis. Graph showing results from the pathway scoring analysis performed using Advanced Analysis nSolver software. Pathway activation scores are plotted as a function of the different treatment type and time points (H 2MIU D1, D8, D64 = high-Treg-responders at D1, D8 and D64; L 2MIU D1, D8, D64 = low-Treg-responders at D1, D8 and D64 and Placebo at D1, D8 and D64). An evident downregulation of several inflammatory pathways is demonstrated in both high and low-Treg-responders although baseline differences were observed between the two treated subgroups.

