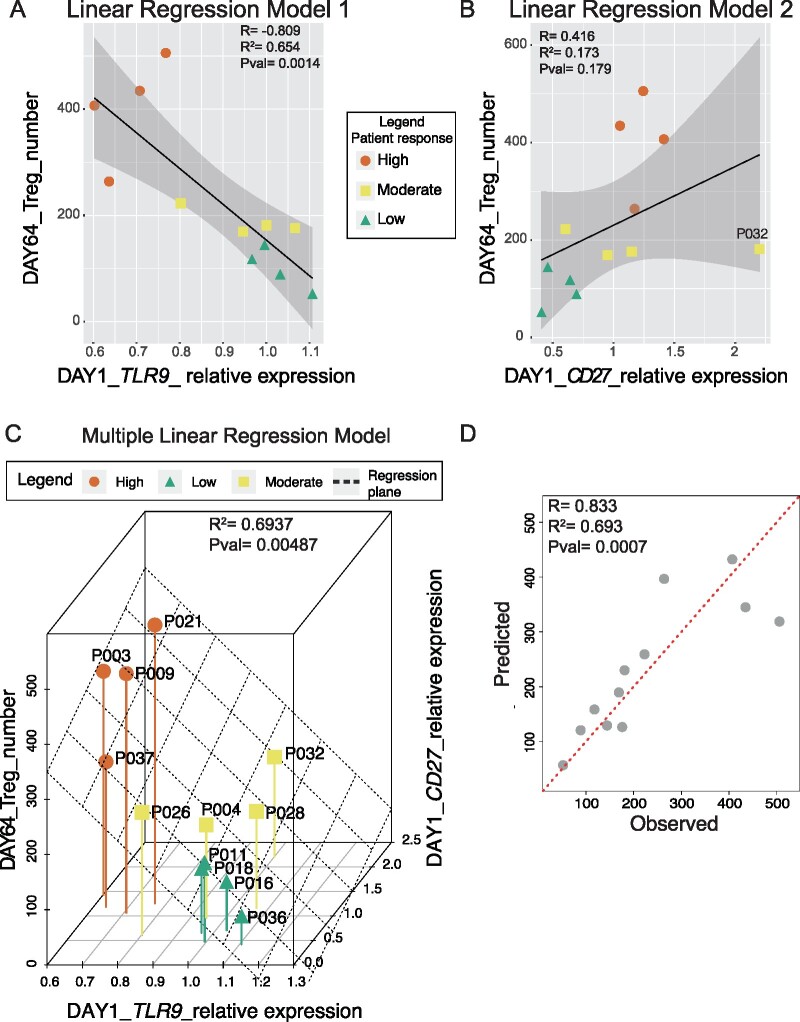
Figure 8.
Biomarker identification analysis. Linear regression models describing the correlation between the expression of TLR9 (A) and CD27 (B) at the baseline (D1) and the Treg number at D64 for each 2MIU-IL-2 treated patient. Each dot represents a trial participant (average expression values computed from 3 qRT-PCR experiments, N = 3) and they are colour-coded depending on their Treg-response type: high (orange dots), moderate (yellow squares) and low (green triangles). A regression line (black) and its regression confidence bands (grey) are also shown. Linear regression model for TLR9 (A: R = −0.809, R2 = 0.654, P-value = 0.0014) was stronger than the model for CD27 (B: R = 0.416, R2= 0.173, P-value = 0.179) (C) Multiple linear regression analysis indicating the relationship between 2 predictors (expression of TLR9 and CD27 at D1) and the response variable (number of Tregs at D64). A good prediction model was obtained (R2 = 0.6937and P-value = 0.00487). Each dot represents a patient and they are colour-coded depending on their Treg-response type: high (orange dots), moderate (yellow squares) and low (green triangles). The regression plane is also displayed in black. (D) Plot showing the correlation between flow-cytometry-measured Treg counts (observed, X-axis) and Treg numbers predicted by our multiple linear model (predicted, Y-axis). Correlation metrics (R = 0.833, R2 = 0.693, P-value= 0.0007) suggest an acceptable predictive model. Each dot represents a sample and a red dotted regression line is also shown.

