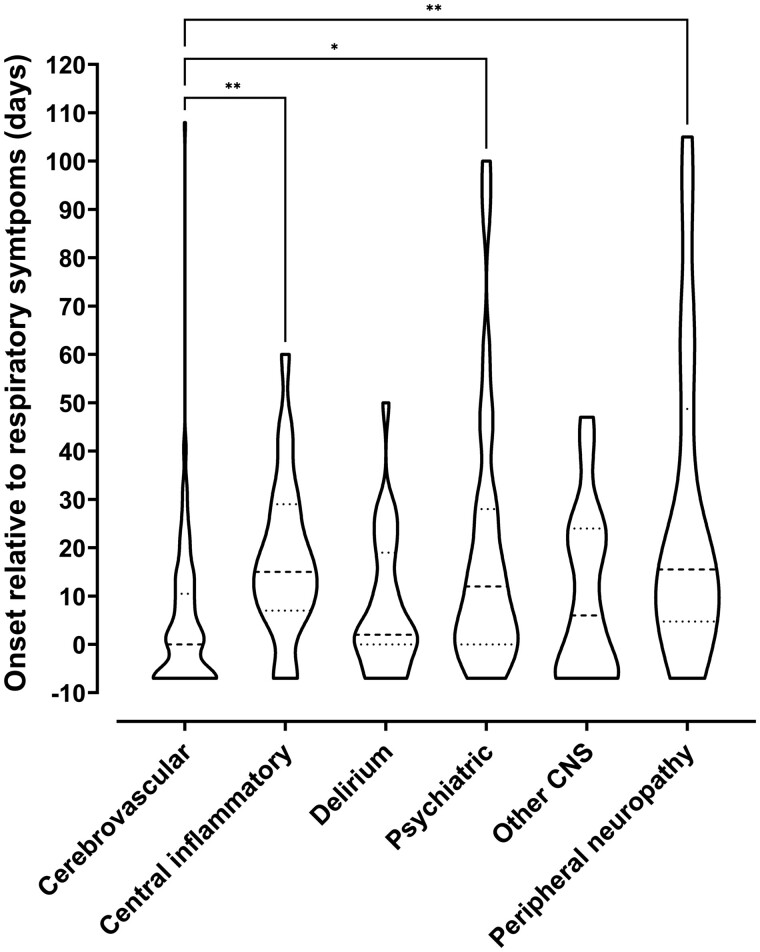
Figure 5.
Timing of onset of neurology. Violin plot demonstrating distributions of time intervals in days between onset of respiratory symptoms and onset of neurological symptoms for each primary diagnostic category. Patients whose neurological symptoms preceded COVID-19 symptoms were arbitrarily assigned a value of minus seven days. The Kruskal–Wallis test was used to determine any significant difference in time intervals between groups (P < 0.0001). Dunn’s multiple group comparison test showed a significant difference between stroke and central inflammatory primary diagnostic groups (P = 0.001), stroke and psychiatric groups (P = 0.037), and stroke and peripheral groups (P = 0.003).

