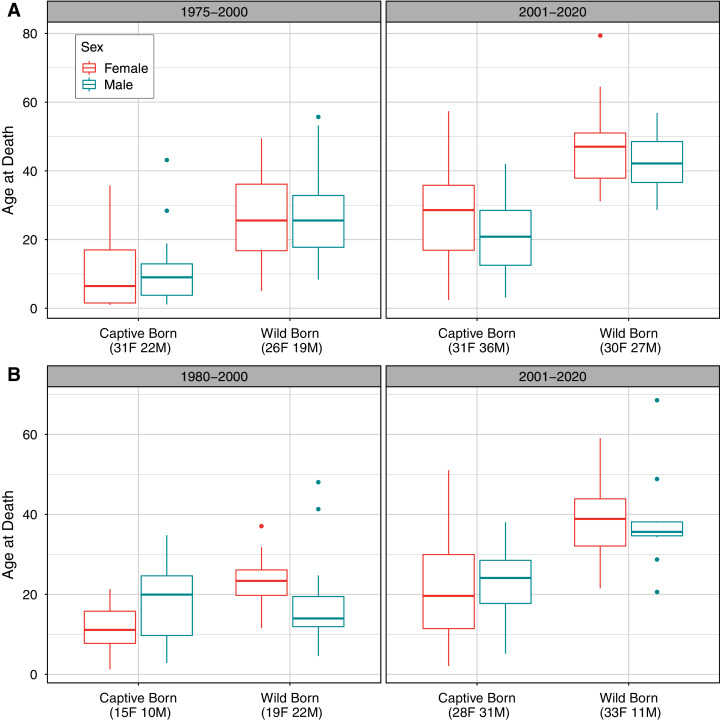
Figure 2. Observed distribution of ages at death by sex, time period, and birth type in (A) the AZA and (B) the Japan captive chimpanzee populations.
Only deaths occurring on or after age one are included. The “early” time period is 1975–2000 for AZA and 1980–2000 for Japan, and the “recent” period is 2001–2020 for both. Sample sizes for the number of observed deaths for females and males are included in parentheses for each group. Note that the y-axis range differs between panels.

