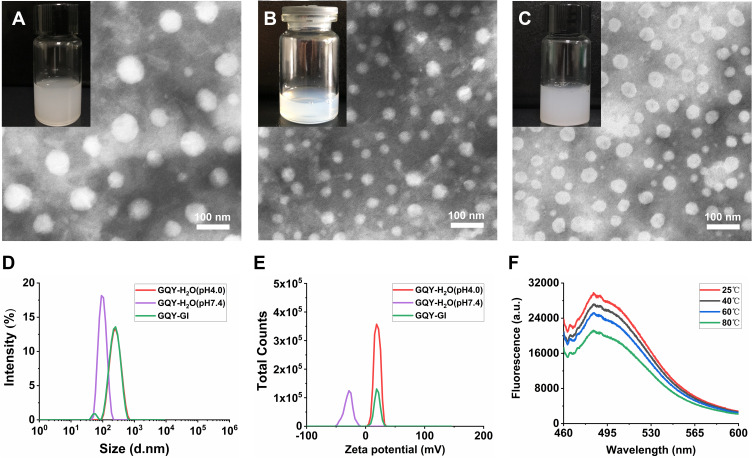
Figure 2.
Formation of stable nanoparticles by GQY. (A–C) TEM images of GQY nanoparticles formed in H2O with pH 4.0 (A), in H2O with pH 7.4 (B) and in GI (C). Insertions show photographs of corresponding GQY solutions. (D) Representative particle size distribution of GQY in H2O with pH 4.0 and 7.4, and GQY in GI. (E) Representative Zeta potential plot of GQY in H2O with pH 4.0 and 7.4, and GQY in GI. (F) ThT-binding fluorescence spectra of GQY in H2O at different temperatures.

