
Figure 2. Vaccine efficacy for individuals seropositive at baseline.
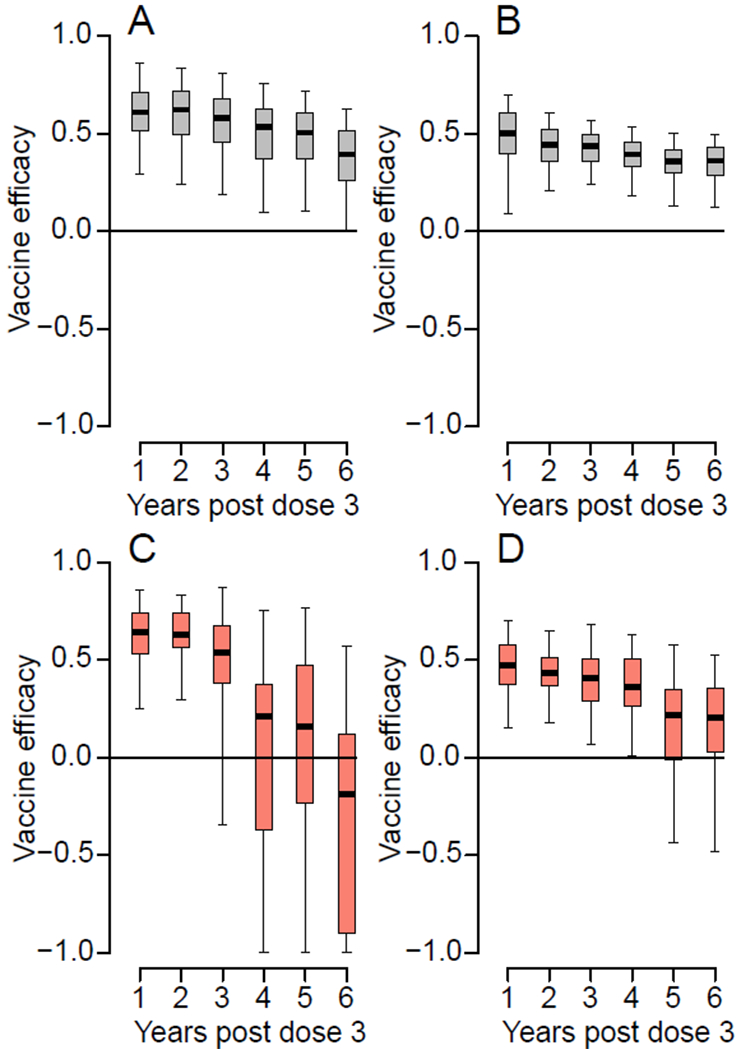
(A) Cumulative vaccine efficacy for symptomatic infection by year. (B) Cumulative vaccine efficacy for subclinical infection by year. (C) Vaccine efficacy for symptomatic infection by year over two-year rolling windows. The estimate is plotted at the maximum of the window (e.g., the vaccine efficacy over years 3-4 post dose three is plotted at year 4). (D) Cumulative vaccine efficacy for subclinical infection by year over two-year rolling windows. In each panel, the boxplot represents the mean, the interquartile range and 2.5 and 97.5 percentiles of the estimated vaccine efficacy from repeated infection history reconstructions (N=100).