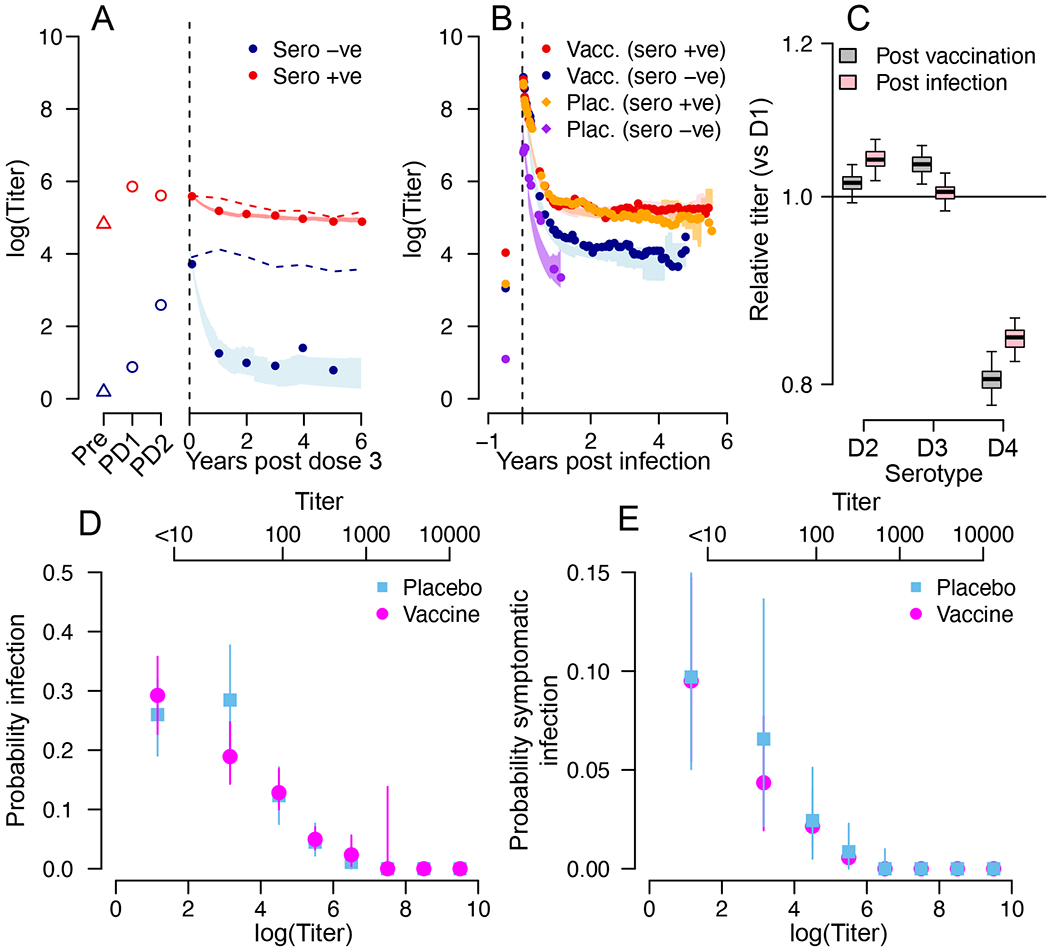
Figure 3. Antibody titer response following vaccination or infection.

(A) Mean titers following vaccination and prior to an infection for those seronegative at baseline (blue) and seropositive at baseline (red). The lines represent the mean estimate and the shaded blue and red areas represent 95% credible intervals from the model. The dashed lines are the mean measured titers when subclinical infections are not removed. ‘Pre’ is pre-dose 1, ‘PD1’ is post dose 1, ‘PD2’ is post dose 2. (B) Mean titers following symptomatic infection for placebo recipients seronegative at baseline (purple), placebo recipients seropositive at baseline (orange), vaccine recipients seronegative at baseline (blue) and vaccine recipients seropositive at baseline (red). The lines represent the mean estimate and the shaded areas represent 95% credible intervals from the model. (C) Mean titer in the year following vaccination comparing each serotype to DENV-1 (black) and mean titer in the year following symptomatic infection comparing each serotype to DENV-1 (red). Each boxplot represents the mean, the interquartile range and 2.5 and 97.5 percentiles of the estimated difference in mean titer from repeated infection history reconstructions (N=100). (D) Mean and 95% confidence intervals for the probability of infection (subclinical or symptomatic) as a function of antibody titer for vaccine recipients (green) and placebo recipients (brown) from repeated infection history reconstructions (N=100). (E) Mean and 95% confidence intervals for the probability of symptomatic infection as a function of antibody titer for vaccine recipients (green) and placebo recipients (blue) from repeated infection history reconstructions (N=100). For (D) and (E) antibody titers on both a linear scale (top axis) and on a natural logarithmic scale (bottom axis) are provided.
