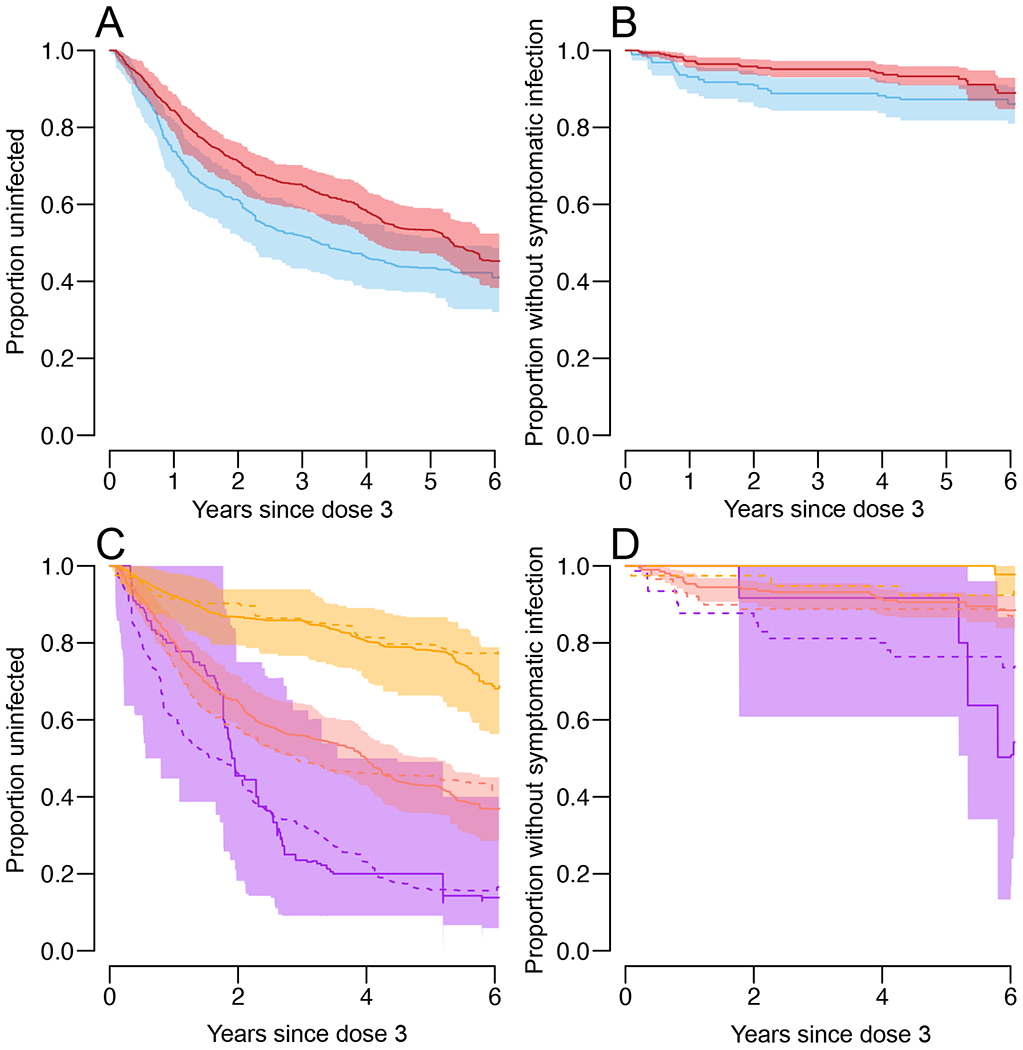
Figure 4. Time-to-event analysis.

a,b, Proportion of baseline seropositive individuals who have not had an infection (subclinical or symptomatic) (a) or a symptomatic infection (b) after dose 3, by vaccination status (vaccination, red; placebo, blue). c,d, Proportion of baseline seropositive individuals who have not had an infection (subclinical or symptomatic) (c) or a symptomatic infection (d) after dose 3, by vaccination and titer status. Placebo, dotted lines; vaccination, solid lines; low titer (<1:50), purple; medium titer (1:50–1:400), salmon; and high titer (>1:400), orange. All panels represent mean and 95% confidence intervals from repeated infection history reconstructions (n = 100).
