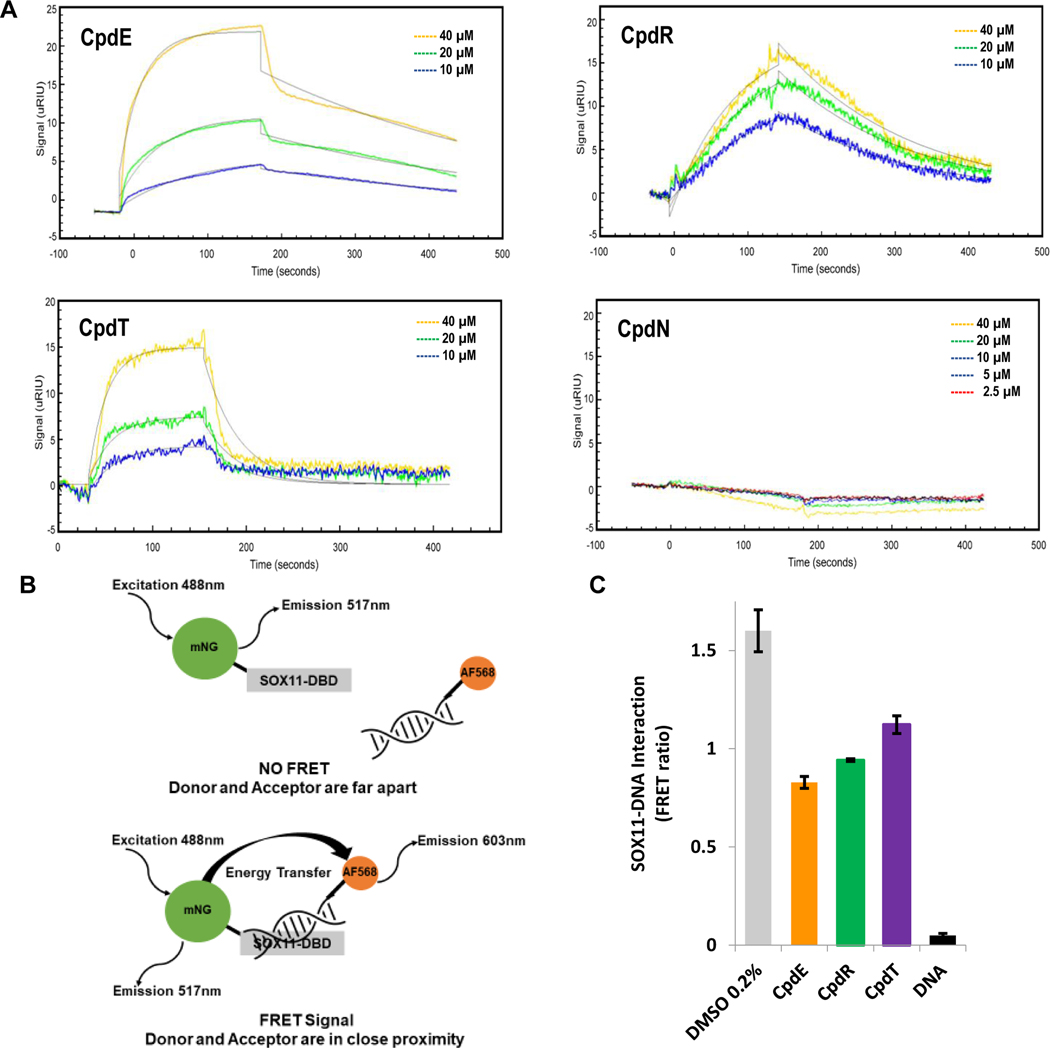
Figure 3. Compounds bind directly to SOX11-DBD and interfere with DNA binding.
(A) Surface plasmon resonance shows that compounds E, R and T bind to SOX11 and have KD values in the μM range calculated by using ka and kd values. Compound N, an inactive compound from our screen, did not show an association and its kinetics constants were not calculable. Each experiment was done two or more times and representative sensograms show binding signal (μRIU) of compounds over time (seconds) to SOX11-DBD. Table S1 shows averages with mean standard deviations for each kinetic constant. (B) Diagram illustrating how the FRET assay works. (C) FRET bar graph shows that compounds E, R and T inhibit SOX11-DNA interaction with a decrease in FRET ratio. DNA with no fluorophore attached was used as a competitive positive control. The average and mean standard deviation were calculated after experiments were done three times.

