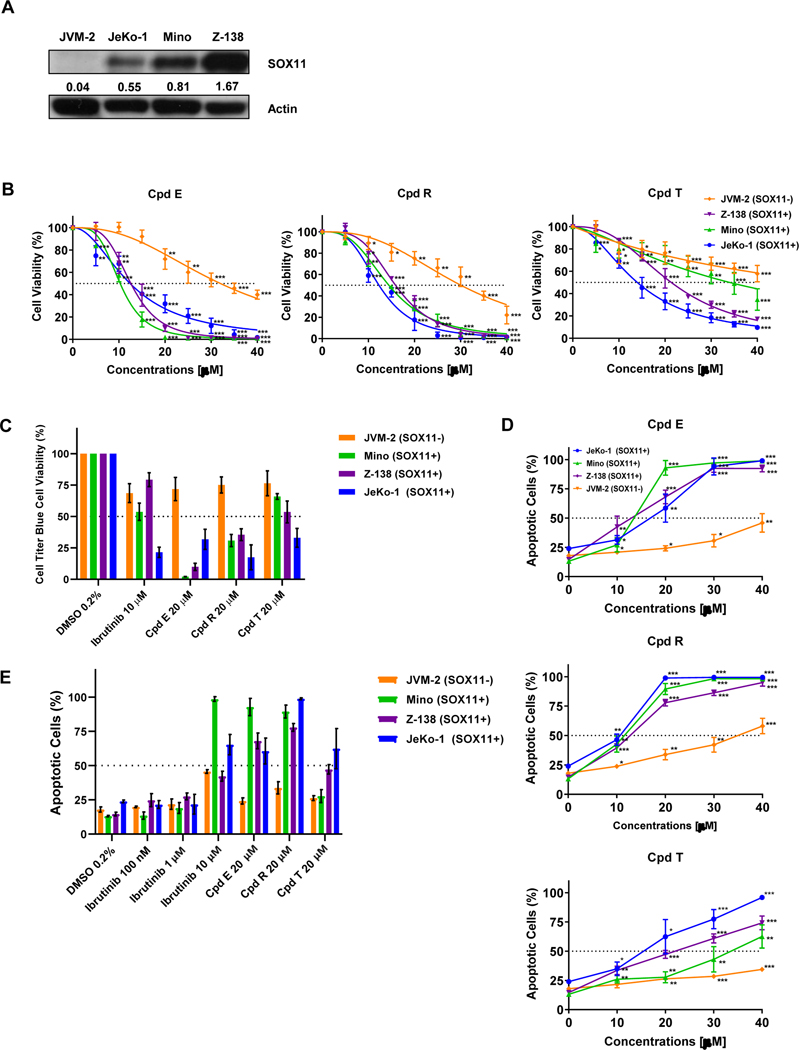
Figure 4. SOX11i are cytotoxic in SOX11 expressing MCL cell lines.
(A) Western blot showing the expression of SOX11 in JVM-2, JeKo-1, Mino and Z-138 Mantle Cell Lymphoma cell lines. The numbers represent SOX11 to Actin ratio. (B) Line graph showing cell titer blue cell viability percentage in JVM-2 (orange), Z-138 (purple), Mino (green) and JeKo-1 (blue) after 72 hours of treatment with compound E, compound R and compound T. Cells were treated with 0 to 40 μM of each compound. The average and mean standard deviation were calculated after experiments were done three times. Student-T Test was used to calculate p-values: P ≤ 0.05 (*), P ≤ 0.01 (**), P ≤ 0.001 (***). (C) Bar graph showing Cell Titer Blue cell viability percentage of cells treated with 0.2% of DMSO, 10μM Ibrutinib or 20 μM of each SOX11i. (D) Line graph showing apoptotic percentage using Annexin V and 7-AAD staining and flow cytometry in JVM-2 (orange), Z-138 (purple), Mino (green) and JeKo-1 (blue) after 72 hours of treatment with compound E, compound R and compound T. Cells were treated with 0 to 40 μM of each compound. The average and mean standard deviation were calculated after experiments were done three times. Student’s t-test was used to calculate p-values: P ≤ 0.05 (*), P ≤ 0.01 (**), P ≤ 0.001 (***). (E) Bar graph showing percent apoptotic cells by FACS analysis of Annexin V and 7-AAD staining after 72 hours of treatment with 0.2% of DMSO, Ibrutinib (100nm, 1μM, 10 μM) or 20 μM of each SOX11i.

