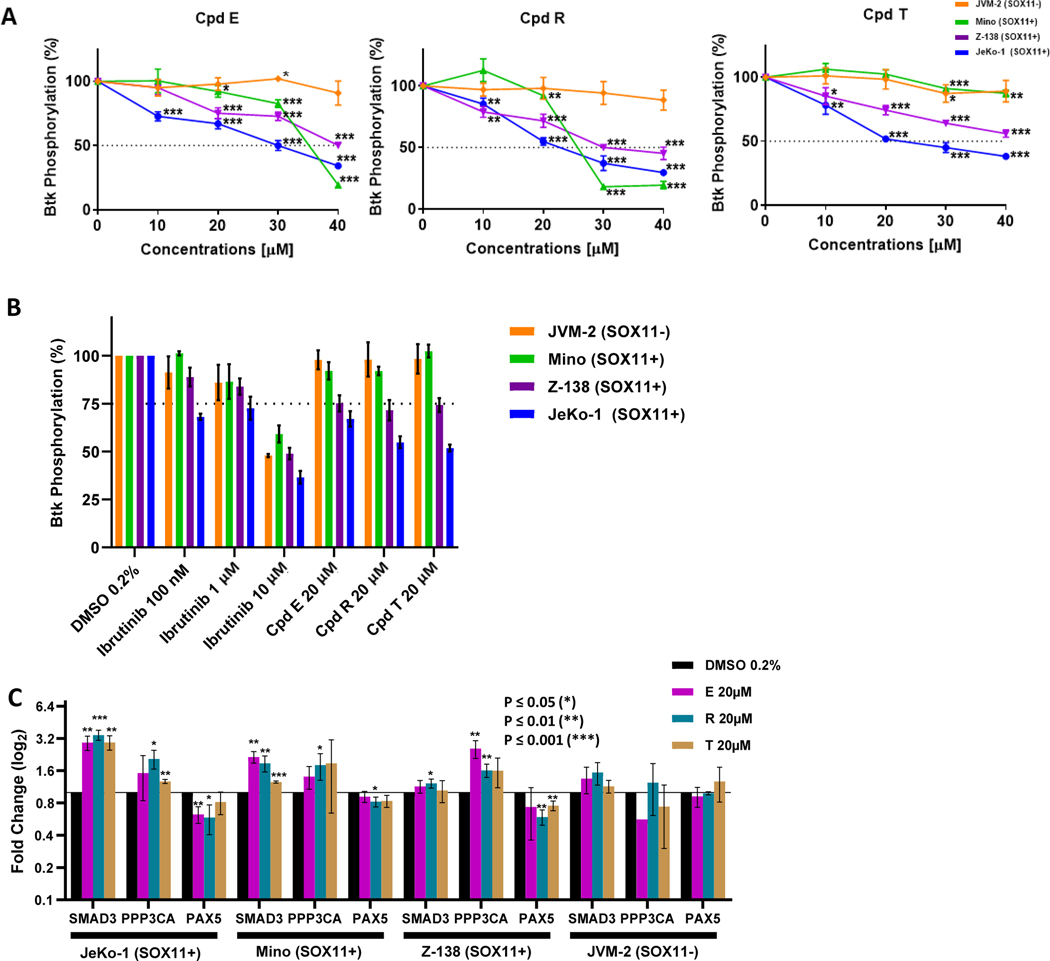
Figure 5. SOX11i inhibit SOX11-dependent signaling and gene expression.
(A) Line graph showing percentage of BTK phosphorylation in JVM-2 (orange), Mino (green), Z-138 (purple) and JeKo-1 (blue) after 24 hours of treatment with compound E, compound R and compound T. Cells were treated with 10 μM, 20 μM, 30 μM and 40 μM of each compound. The average and mean standard deviation were calculated after experiments were done three times. Student’s t-test was used to calculate p-values: P ≤ 0.05 (*), P ≤ 0.01 (**), P ≤ 0.001 (***). (B) Bar graph showing percentage of BTK phosphorylation in JVM-2 (orange), Mino (green), Z-138 (purple) and JeKo-1 (blue) after 24 hours of treatment with 0.2% of DMSO, 20 μM of compound E, 20 μM of compound R, 20 μM of compound T, 1 μM of Ibrutinib and 10 μM of Ibrutinib. (C) mRNA expression of SMAD3, PPP3CA and PAX5 after JeKo-1, Mino, and Z-138 were treated with 0.2% of DMSO (black), 20 μM of compound E (pink), 20 μM of compound R (teal), and 20 μM of compound T (gold) for 24 hours. The average and mean standard deviation were calculated after experiments were done three times. Student’s t-test was used to calculate p-values: P ≤ 0.05 (*), P ≤ 0.01 (**), P ≤ 0.001 (***).

