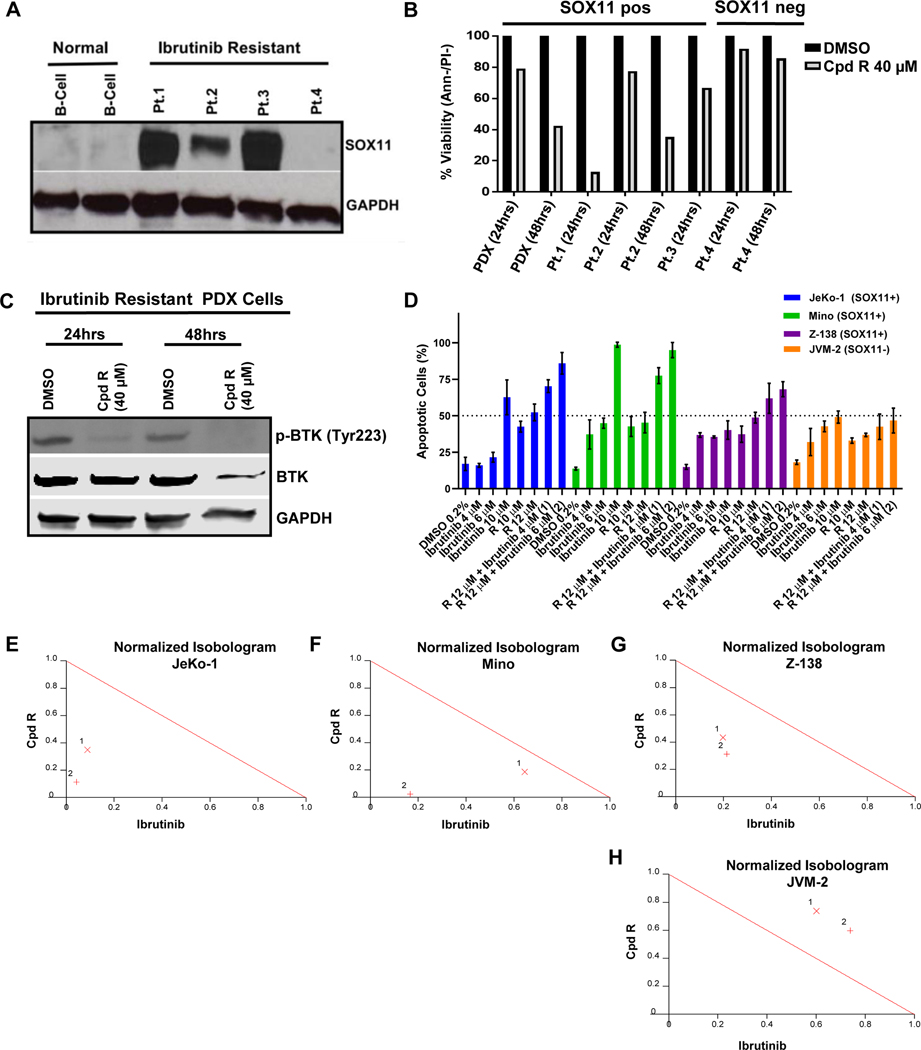
Figure 6. Compound R induces cell death in Ibrutinib-resistant primary MCL and is synergistic with Ibrutinib in SOX11+ MCL cell lines.
(A) Immunoblot analysis showing SOX11 expression in whole cell lysates from 4 primary MCL patient samples with acquired resistance to Ibrutinib compared to normal B lymphocytes from 2 healthy donors. GAPDH was used as a loading control. (B) The same 4 Ibrutinib resistant MCL primary patient samples in addition to cells obtained from an MCL PDX mouse model (derived from Pt. 2) were treated with 40 μM of compound R for 24 and 48 hours. Viability of the cells was obtained by Annexin V−/propidium iodide−staining and flow cytometry at the indicated time points. Graph shows normalized percentage of live cells relative to the DMSO treated control from 1 experiment. (C) Immunoblot analysis showing the expression levels of total BTK and phosphorylated BTK (p-BTKTyr223) in whole cell lysates from the Ibrutinib resistant PDX cells after treatment with 40 μM of compound R at the indicated time points. Decrease in p-BTK level was noted upon treatment with compound R as of 24 hours compared to the DMSO control. GAPDH used as loading control. (D) Bar graph showing the viability of JeKo-1, Z-138, Mino and JVM-2 after 72 hours of treatment with compound R alone and in combination with Ibrutinib at different concentrations. Viability was obtained by using Annexin V and 7-AAD staining and flow cytometry. The average and mean standard deviation were calculated after experiments were done three times. (E-H) Normalized isobolograms derived from combination index values obtained for JeKo-1 (E), Z-138 (F), Mino (G) and JVM-2 (H) cells treated with combinations of Compound R and Ibrutinib two different sets of concentrations show synergy between the two agents in all three SOX11-positive cells lines but antagonism in the SOX11-negative cell line. The theoretical oblique red line is an isobole with a CI value of 1.0 denoting an additive effect. As seen here, CI values of <0.9 which fall well below the red line indicate strong synergism (http://www.biosoft.com/w/calcusyn.htm).

