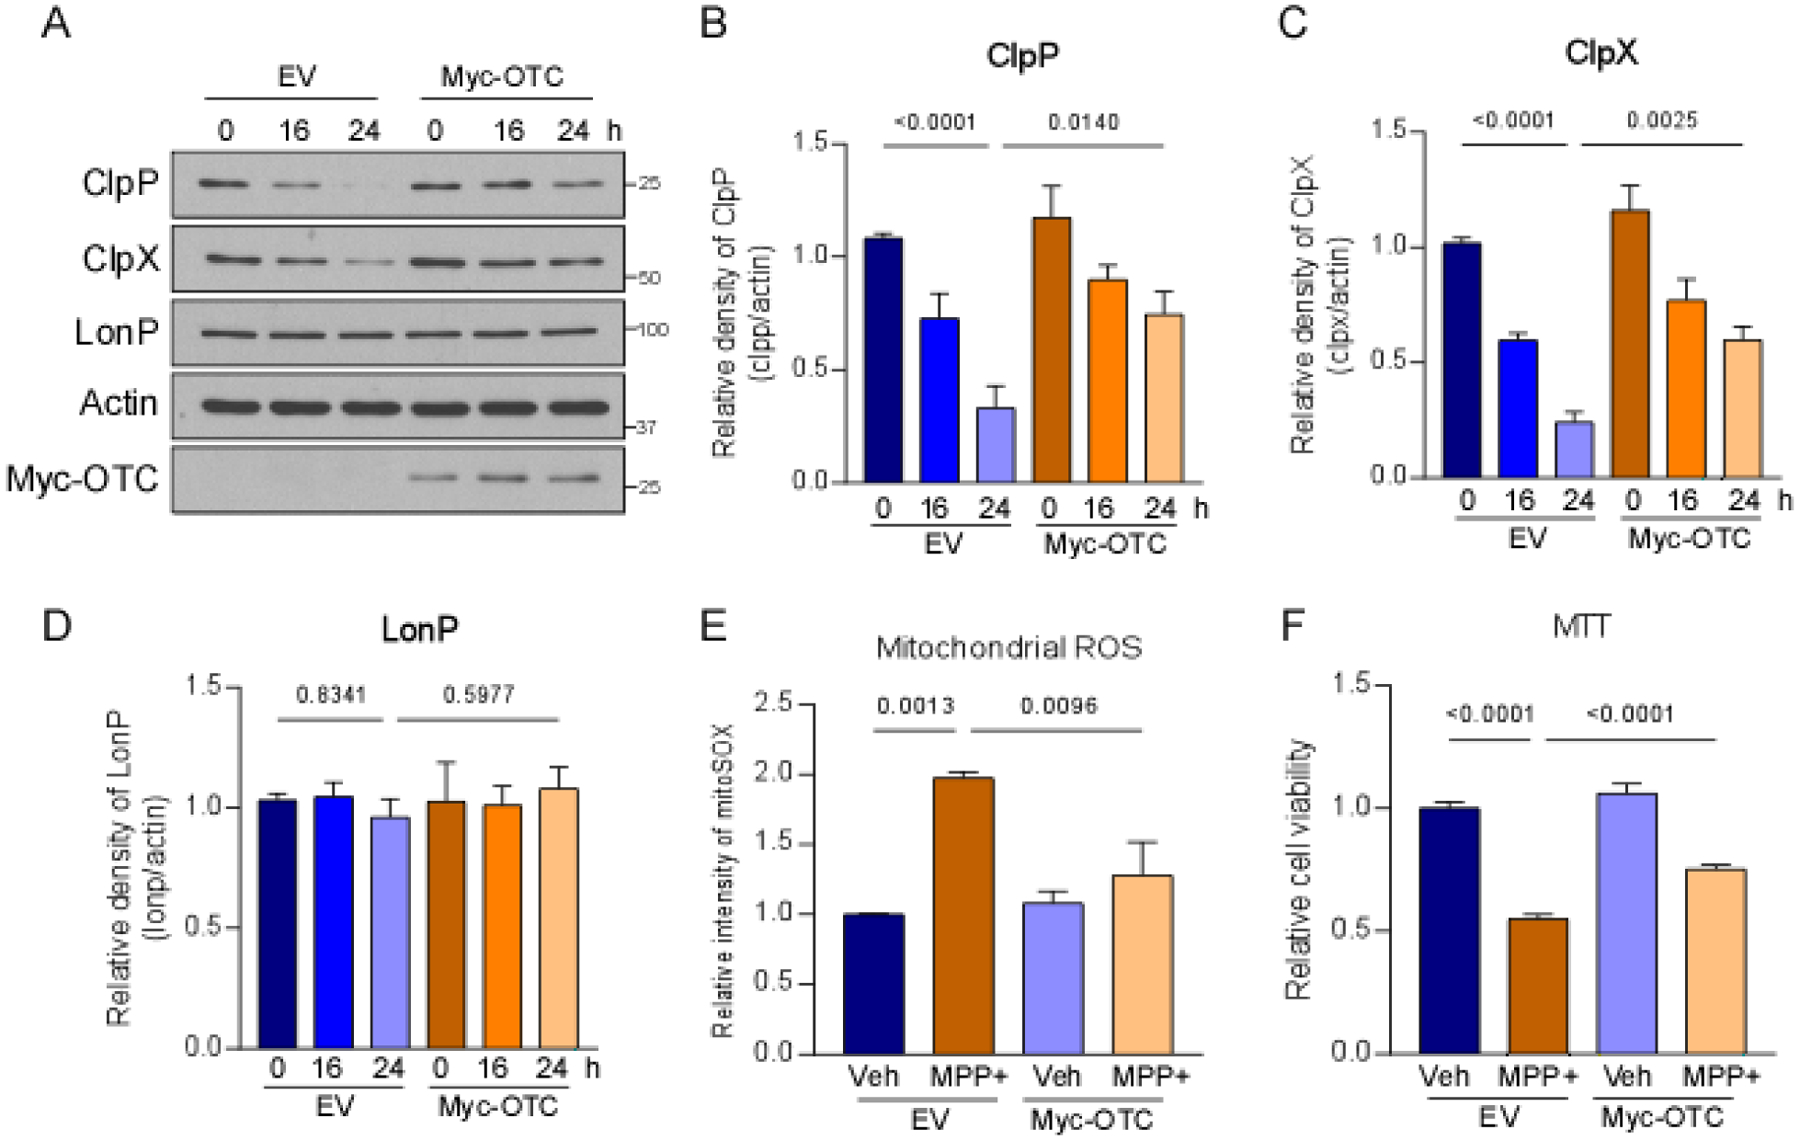
Fig. 3. UPRmt activation conferred protection against MPP+-induced toxicity.

SH-SY5Y cells were treated with 2 mM MPP+ after the overexpression of Δ-OTC. (A) Total protein lysates were harvested after MPP+ treatment and subjected to Western blot analyses with the indicated antibodies. The Histograms show the density of (B) ClpP, (C) ClpX, and (D) LONP protein levels relative to total protein levels. (E) Cells were stained with MitoSOX™ dye to assess mitochondrial superoxide production after 24 h treatment with MPP+. The histogram shows the relative fluorescence density of MitoSOX. (F) Cell viability was examined by the MTT assay after 24 h treatment with MPP+. The histogram shows relative cell survival. The data are expressed as the mean ± SEM of three independent experiments. Data are compared with one-way ANOVA with Tukey’s post hoc test.
