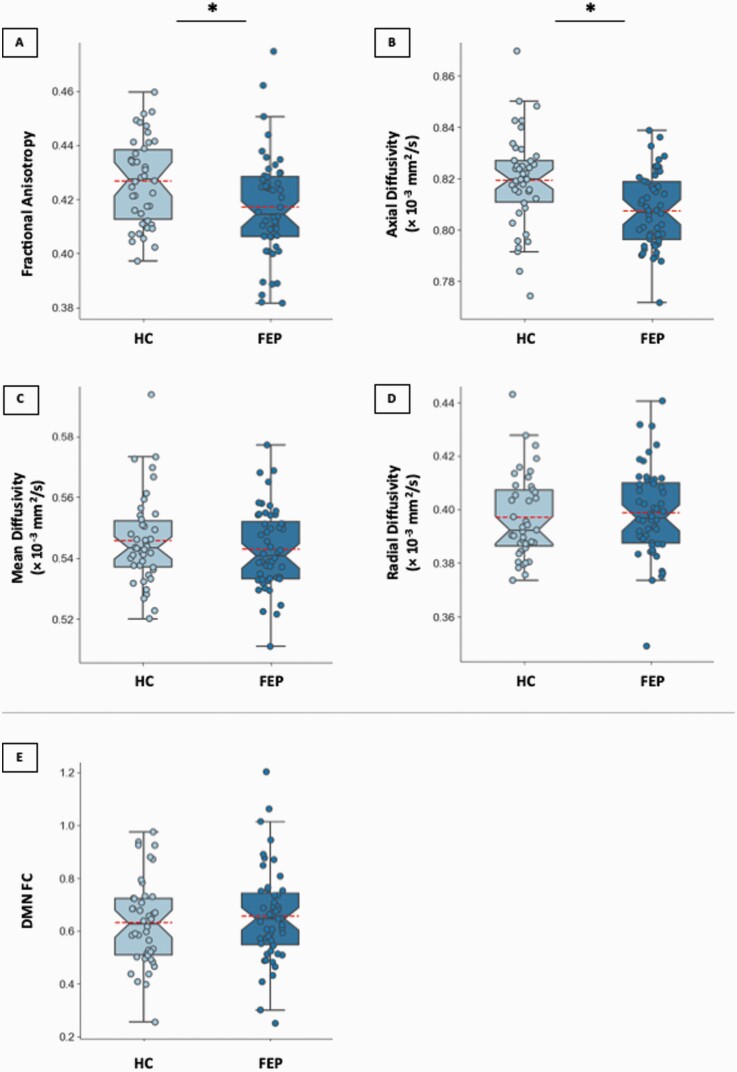
Fig. 2.
Boxplots depicting DMN DWI data for each group for (A) fractional anisotropy, (B) axial diffusivity, (C) mean diffusivity, and (D) radial diffusivity; and (E) boxplot depicting FC values for each group. Each individual dot is a data point from a single subject and red lines indicate average value for each group. HC, healthy control; FEP, first episode psychosis; DMN, default mode network; DWI, diffusion weighted imaging; and FC, functional connectivity. *p < 0.05, FDR corrected.

