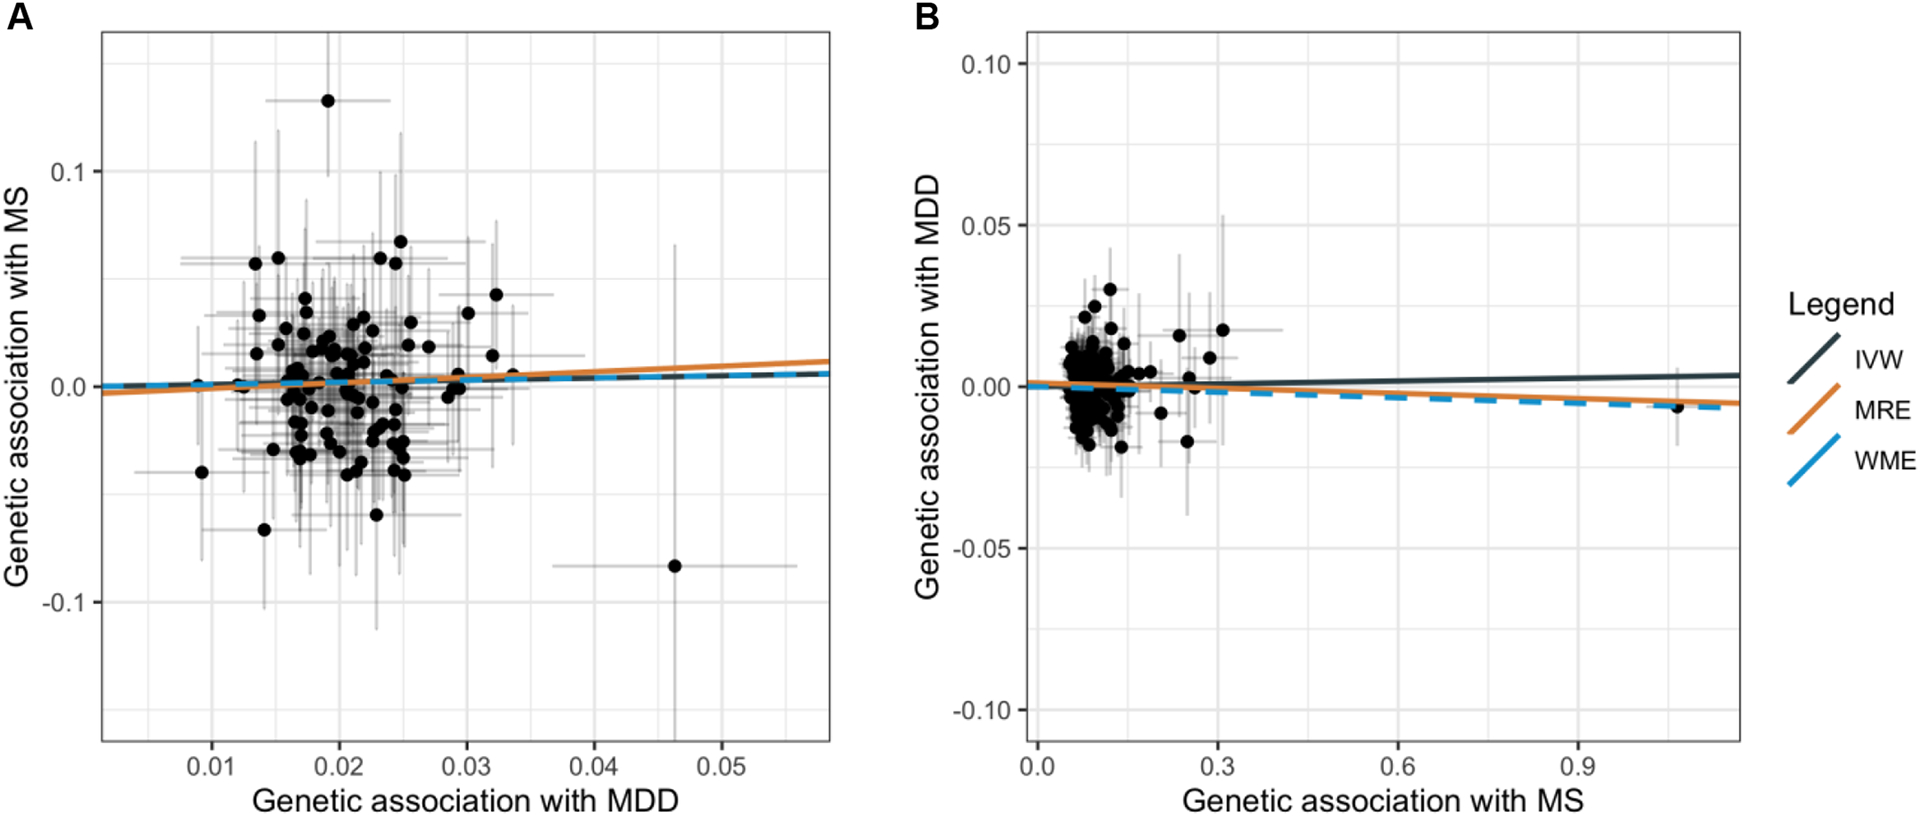
Figure 2. Scatterplots for bidirectional MR of MDD with MS.

Scatterplots showing the genetic estimates for the outcome along the y axis against the estimates for the exposure along the x axis (log odds ratio with 95% CI). A. Effect of genetic liability to MDD on odds of MS. B. Effect of genetic liability to MS on odds of MDD. The slope of each line represents the MR estimate for the corresponding method. MDD = major depressive disorder; MS = multiple sclerosis; MR = mendelian randomization.
