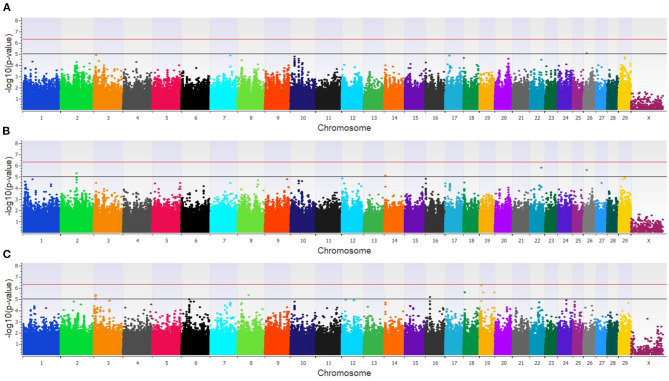
Figure 3.
Manhattan plots identifying loci associated with bovine coronavirus infection in additive (A), dominant (B), and recessive (C) EMMAX models for the combined dairy and feedlot population. Single-nucleotide polymorphisms (SNP) are represented by a single dot. Bovine chromosomes are listed on the x-axis. SNPs located between the black and red lines provide evidence of a moderate association (p between 1 × 10⁻⁵ and 5 × 10−07), and SNPs above the red line provide evidence of a strong association (p < 5 × 10⁻⁷) based on the Wellcome Trust Case Control Consortium (24) guidelines.

