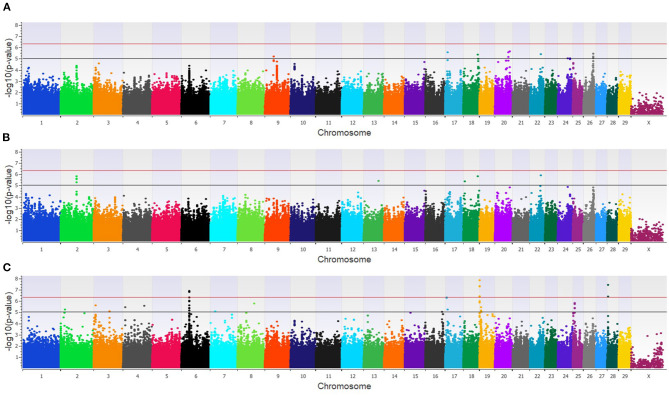
Figure 6.
Manhattan plots identifying loci associated with bovine coronavirus infection and bovine respiratory disease in additive (A), dominant (B), and recessive (C) EMMAX models for the combined dairy and feedlot population. Single-nucleotide polymorphisms (SNP) are represented by a single dot. Bovine chromosomes are listed on the x-axis. SNPs located between the black and red lines provide evidence of a moderate association (p between 1 × 10⁻⁵ and 5 × 10⁻⁷), and SNPs above the red line provide evidence of a strong association (p < 5 × 10⁻⁷) based on the Wellcome Trust Case Control Consortium (24) guidelines.

