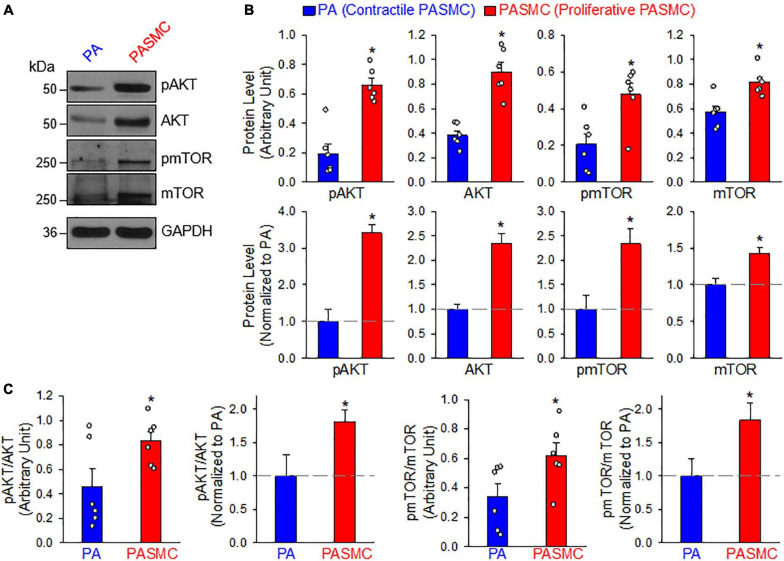
FIGURE 3.
AKT/mTOR signaling is increased in synthetic or proliferative PASMCs. (A): Representative Western blot analyses on phosphorylated (p) AKT (pAKT), AKT, pmTOR, and mTOR in freshly isolated PA (mainly containing contractile PASMCs) and primary cultured PASMCs (mainly containing proliferative PASMC). GAPDH was used as loading control. (B): Summarized data (mean ± SE, n = 6) showing protein expression levels of pAKT, AKT, pmTOR, and mTOR in the PA and PASMCs. Data are presented as arbitrary units (upper panels) or normalized to PA tissue (lower panels). (C): Summarized data (mean ± SE, n = 6) showing the ratio of pAKT/AKT and pmTOR/mTOR in the PA and the PASMCs. The horizontal broken lines indicate the protein level in the PA. *p < 0.05 vs. PA (Contractile PASMC).

