FIGURE 6.
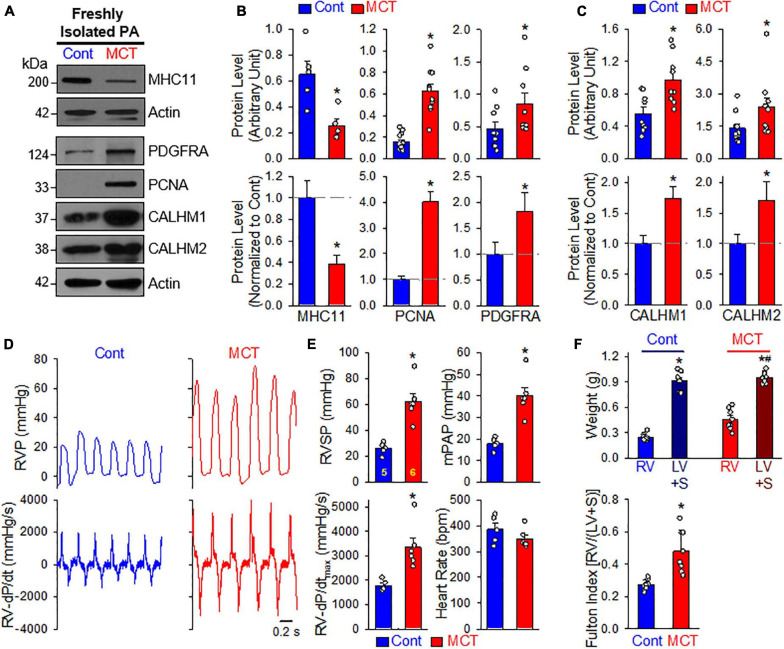
Upregulated CALHM1 and CALHM2 in freshly isolated PA from rats with monocrotaline (MCT)-induced pulmonary hypertension (PH). (A–C): Representative images (A) and summarized data (mean ± SE, n = 5–13) showing protein levels of MHC11 (n = 5), PCNA (n = 13), PDGF receptor α (PDGFRα, n = 9) (B) as well as CALHM1 and CALHM2 (C) in freshly isolated PA (mainly containing contractile PASMC) from vehicle- (Cont) or MCT-injected rats. *p < 0.05 vs. Cont rats. (D): Representative records of right ventricular pressure (RVP, upper panels) and right ventricule (RV) contractility (RV- ± dP/dt, lower panels) in control rats (Cont) and MCT-injected rats (MCT). (E): Summarized data (mean ± SE, n = 5 for Cont rats and n = 6 for MCT rats) showing right ventricular systolic pressure (RVSP, a surrogate measure of pulmonary arterial systolic pressure), mean PAP (mPAP), RV-+dP/dtmax and heart rate in control rats and MCT-injected rats. *p < 0.05 vs. Cont rats. (F): Summarized data (mean ± SE, n = 9 for each group) showing the dry weight of the RV and the left ventricle (LV) and septum (S) (upper panel), as well as Fulton Index (lower panel), the ratio of the weight of RV to the weight of LV and S [RV/(LV+S)] in vehicle- (Cont) or MCT-injected rats. *p < 0.05 vs. RV in Control rats; #p < 0.05 vs. RV in MCT-injected rats (upper panel); *p < 0.05 vs. Cont rats (lower panel).

