
FIGURE 4.
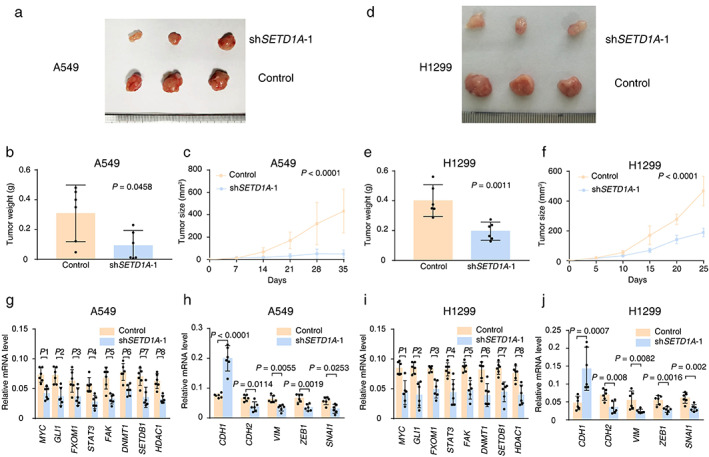
SETD1A silencing prevents tumorigenesis and EMT of NSCLC cells in nude mice. (a) The image of tumor tissue from nude mice with A549 cell transplantation at the end point (35 days after inoculation). (b) Average tumor weight of A549 xenografts with SETD1A knockdown at the end point (n = 6). (c) Tumor volumes of A549 xenografts with SETD1A knockdown in nude mice (n = 6). (d) The tumor images from nude mice with H1299 cell transplantation at the end point (25 days after inoculation). (e),(f) Tumor weight and volumes of H1299 xenografts with SETD1A knockdown in nude mice (n = 6). (g),(h) qPCR results for mRNA levels of oncogenes and EMT‐related genes in A549 xenografts (n = 6). P1 = 0.0017, P2 = 0.005, P3 = 0.0201, P4 = 0.005, P5 = 0.0015, P6 = 0.0012, P7 = 0.005, P8 = 0.0001. (i),(j) qPCR results for mRNA levels of oncogenes and EMT‐related genes in H1299 xenografts (n = 6). P1 = 0.0089, P2 = 0.0157, P3 = 0.0056, P4 = 0.0138, P5 = 0.0063, P6 = 0.0055, P7 = 0.0158, P8 = 0.0062. Statistical tests were analyzed by using the Welch's t‐test after log transformation (b),(e),(g)–(j) or two‐way ANOVA (c),(f). n means independent biological sample