Figure 5.

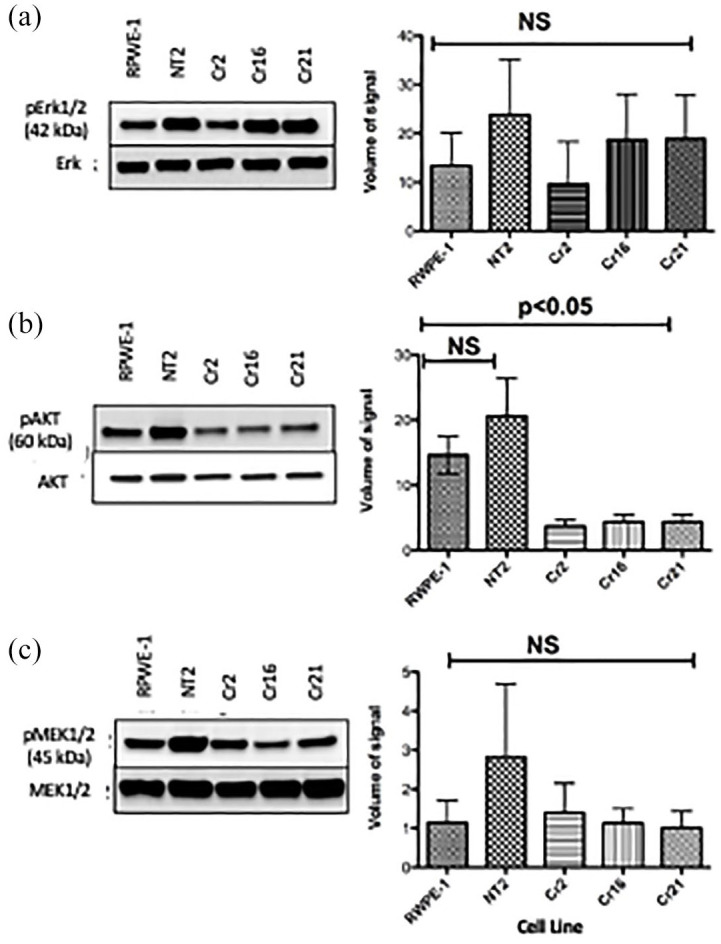
CHD1 KO cells Cr2, Cr16, and Cr21 show decreased pAKT levels. (a) Left: Western blot showing similar pErk expression in all cell lines. Right: Plot demonstrating pErk/Erk signal volume. There was no significant difference in pErk/Erk between cell lines. Error bars represent standard deviation. (b) Left: Western blot demonstrating that CHD1 KO lines express significantly lower pAKT levels than RWPE-1 and NT2 cell lines. Right: Plot depicting greater levels of pAKT/AKT in RWPE-1 and NT2 cell lines than CHD1 KO cell lines. Error bars represent SD. (c) Left: Western blot showing similar levels of pMEK in the five cell lines. Right: Plot depicting pMEK/MEK signal volume. There was no significant difference in pMEK/MEK between cell lines. Error bars represent standard deviation.
CHD1, chromodomain helicase DNA binding protein 1; KO, knockout; pAKT, protein kinase B; pERK, protein extracellular signal-regulated kinase; pMEK, protein mitogen-activated protein kinase; NT2, non-target cells; SD, standard deviation.
