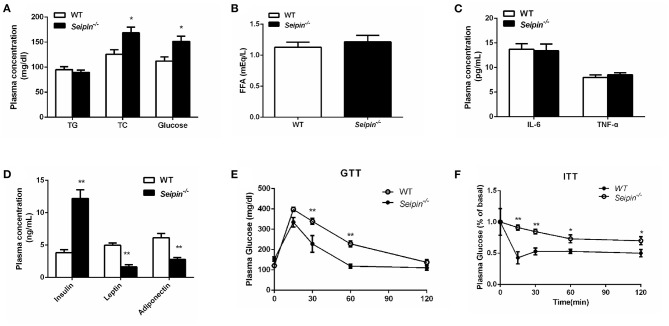
Figure 1.
Insulin resistance in WT and Seipin deleted mice. (A) Plasma triglyceride (TG), total cholesterol (TC), glucose content in mice fasted for 4 h. (B) Free fatty acid (FFA) in mice fasted for 4 h. (C) Plasma levels of IL-6, TNF-α in mice fasted for 4 h. (D) Plasma insulin, leptin, adiponectin content in mice fasted for 4 h. (E) Glucose tolerance tests and insulin tolerance tests (F) performed on 6-month-old Seipin−/− and WT mice. Data are expressed as mean ± SEM. N = 6. *P < 0.05, **P < 0.01 for Seipin−/− mice vs. WT.

