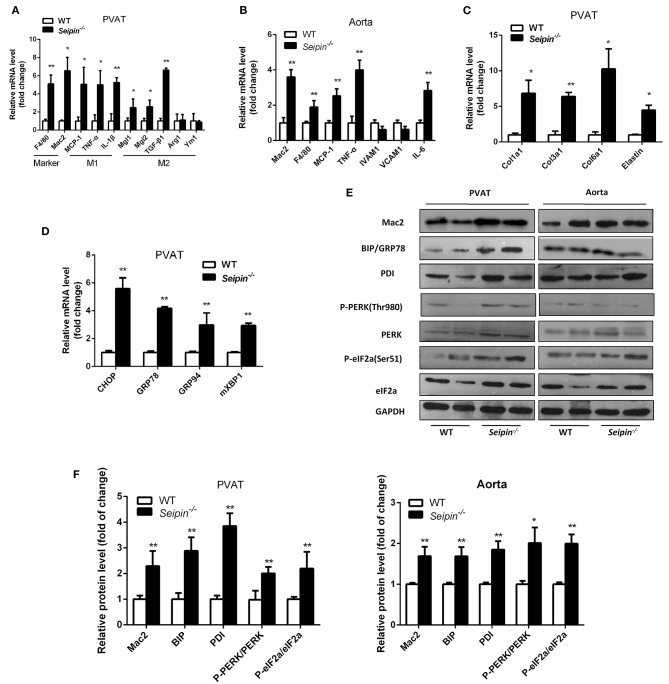
Figure 4.
Inflammation, fibrosis and ER stress gene expression in PVAT and aorta from WT and Seipin−/− mice. Relative mRNA levels of macrophages and inflammatory cytokines (A,B), fibrosis (C), and ER stress (D) in PVAT and aorta from 6-month-old WT and Seipin−/− mice. N = 6. (E,F) Western blot images and densitometric quantitation for the indicated proteins and phosphoproteins related to inflammation and ER stress in PVAT from WT and Seipin−/− mice. Data are expressed as mean ± SEM. N = 6, *P < 0.05, **P < 0.01 for Seipin−/− mice vs. WT.

