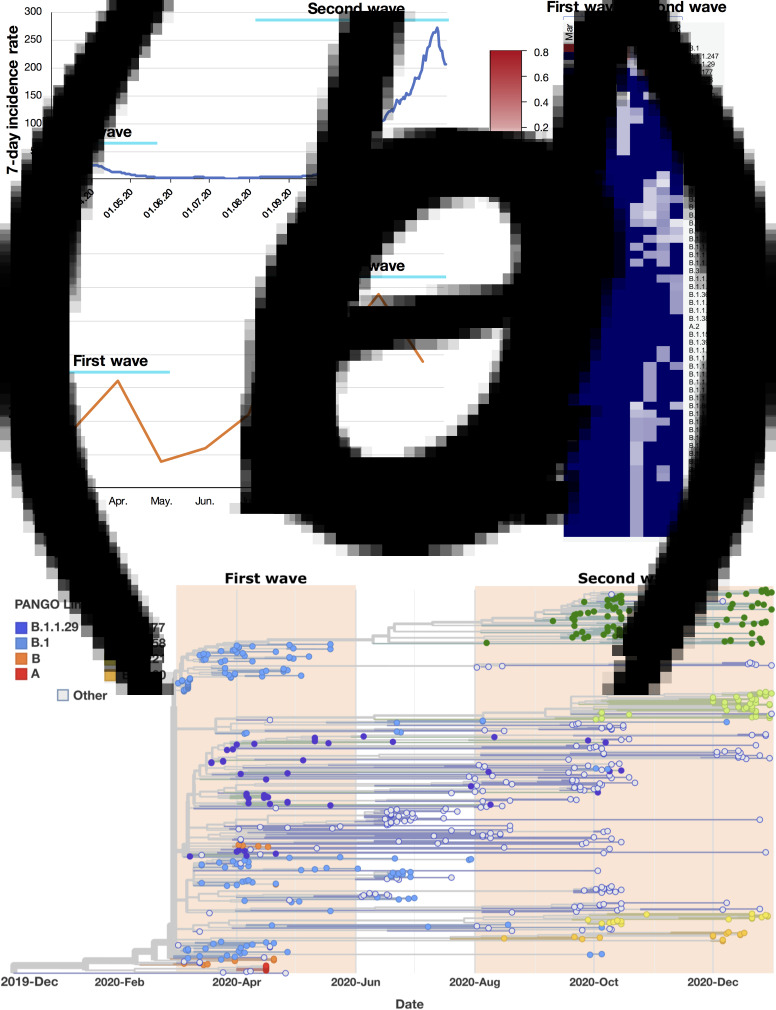
Fig. 1.
Analysis of SARS-CoV-2 lineages predominant in the first and second waves in Eastern Germany, March to December 2020. (A) 7-day incidence rate per 100 000 inhabitants in Eastern Germany. First wave: March to May; second wave: August to December. (B) Summary of detected total SARS-CoV-2 lineage numbers in each month. (C) Frequency of detection for each SARS-CoV-2 lineage in each month in Eastern Germany (range: 0–0.74, representing 0–74%; 0 is shown with deep blue, indicating no detection of the relevant variant in that month). Note: To achieve a better resolution, a few lineages that were detected only once across 2020 and with a frequency of <0.01 were omitted from the heatmap. (D) Phylogenetic and time tree of SARS-CoV-2 genomes from Eastern Germany, March to December 2020. Each genome is denoted with Pangolin-lineage (PANGO Lineage). The names of lineages that were predominant in the first or second wave are colour labelled. The four lineages from the second wave B.1.177, B.1.258, B. 1.221 and B.1.160 had been circulating in multiple other European countries since June [1].

