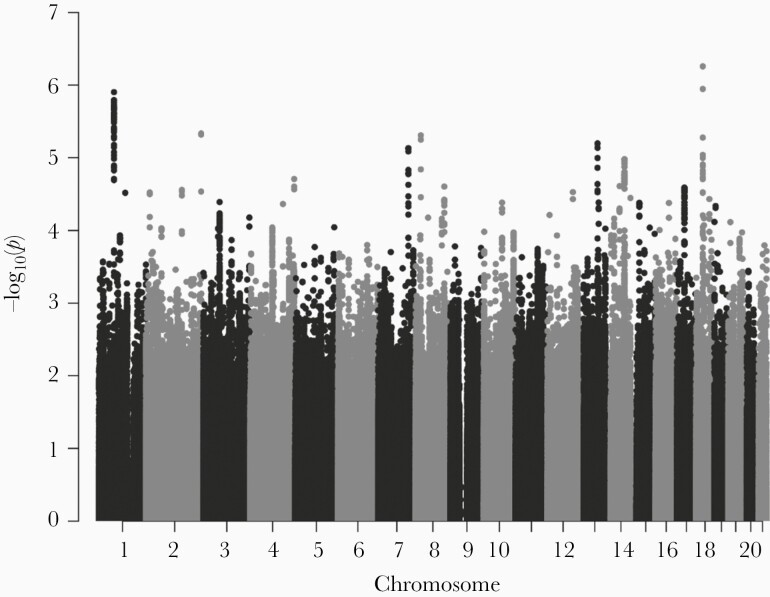
Figure 2.
Manhattan plot summarizing the infertility genome-wide association study (GWAS) results of the Centers for Disease Control and Prevention-funded study. Each dot represents 1 single-nucleotide polymorphism (SNP). The x-axis indicates the physical base-pair position of each tested SNP; y-axis indicates the −log(10) P values from GWAS.

