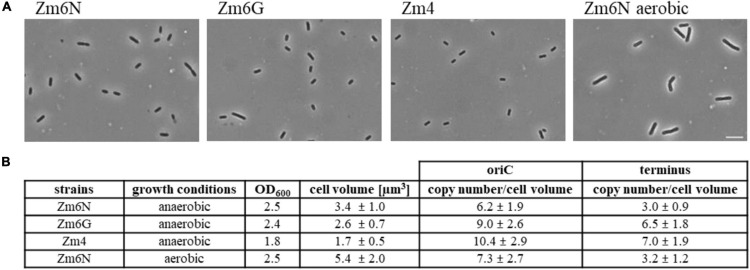
FIGURE 6.
Determination of genome copy numbers per μm3 cell volume. (A) Phase contrast images of anaerobically growing Zm6N, Zm6G, and Zm4, and aerobically growing Zm6N cells. Scale bar; 7.85 μm. (B) A table of cell volume and genomic copy numbers per cell volume in Zm6N, Zm6G, and Zm4 during anerobic growth, and Zm6N during aerobic growth. Cell length and width were measured and used for calculating approximate cell volume. Sample numbers for cell length and width measurements; N = 110 and 53 for anaerobically growing Zm6N, respectively, N = 120 and 52 for Zm6G, N = 110 and 57 for Zm4, and N = 120 and 56 for aerobically growing Zm6N.

