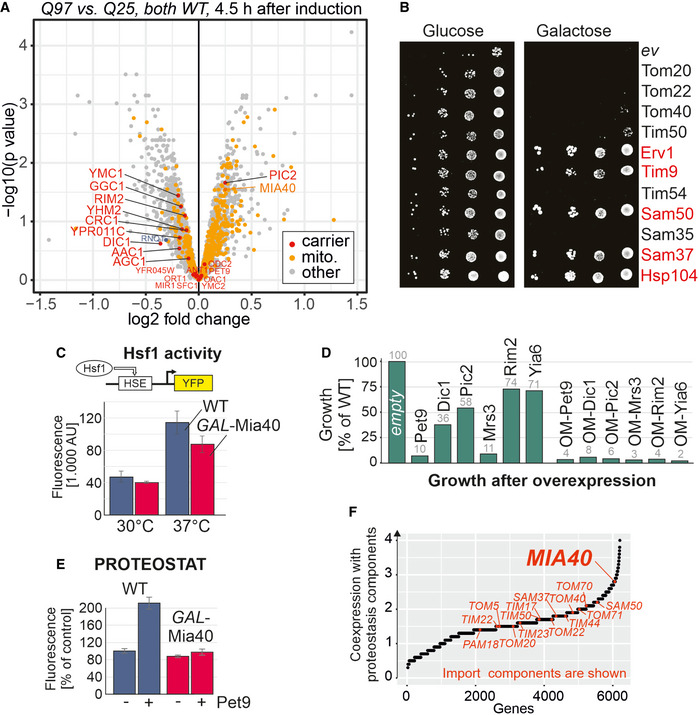
Figure 7. Mitochondrial membrane proteins can pose a threat to cytosolic proteostasis.

- Q25‐GFP and Q97‐GFP were expressed in wild‐type cells for 4.5 h. Cell extracts were subjected to mass spectrometry‐based proteomics. The levels of Mia40 and other mitochondrial proteins (mito., yellow) and carrier proteins (orange) are visualized in a volcano plot (P‐values were derived using a moderated t‐test). The position of Rnq1 is indicated in blue.
- The open reading frames of the indicated proteins were cloned downstream of a GAL promoter in plasmids and transformed into cells harboring the Q97‐GFP expression plasmid. Cells harboring an empty vector (ev) were used for control. Cells were shifted to galactose medium overnight before they were dropped onto glucose or galactose plates. If cells are directly dropped from lactate medium onto galactose plates, only individual cells (indicated by red protein names) escaped the polyQ toxicity (see Fig EV4C).
- Wild‐type and GAL‐Mia40 cells were transformed with plasmids that express yellow fluorescent protein (YFP) under the control of a minimal promoter containing the Hsf1‐driven heat shock element (HSE). Cells were grown at 30 or 37°C before fluorescence was measured. Mean values and standard deviations of three replicates are shown.
- Cells expressing the indicated carrier proteins from GAL promoters were dropped onto galactose plates. Cell growth was quantified by densitometry from one representative plate. OM refers to carrier proteins that were expressed as fusions with an N‐terminal outer membrane anchor. See Fig EV4 D and E for scans of the respective plates.
- The formation of protein aggregates was detected with a PROTEOSTAT protein aggregation assay. The expression of the most abundant mitochondrial carrier protein, Pet9, resulted in a strongly increased fluorescence in wild‐type cells but not in GAL‐Mia40 cells. Mean values and standard deviations of three replicates are shown.
- Using the SPELL data collection of transcription data sets, we calculated the co‐expression of yeast genes with genes relevant for proteostasis (chaperones, proteasome, and others; see Materials and Methods for details). Genes for mitochondrial import components are highlighted.
Source data are available online for this figure.
