
Figure 1. TOR activity is a major regulator of cellular protein synthesis rates.
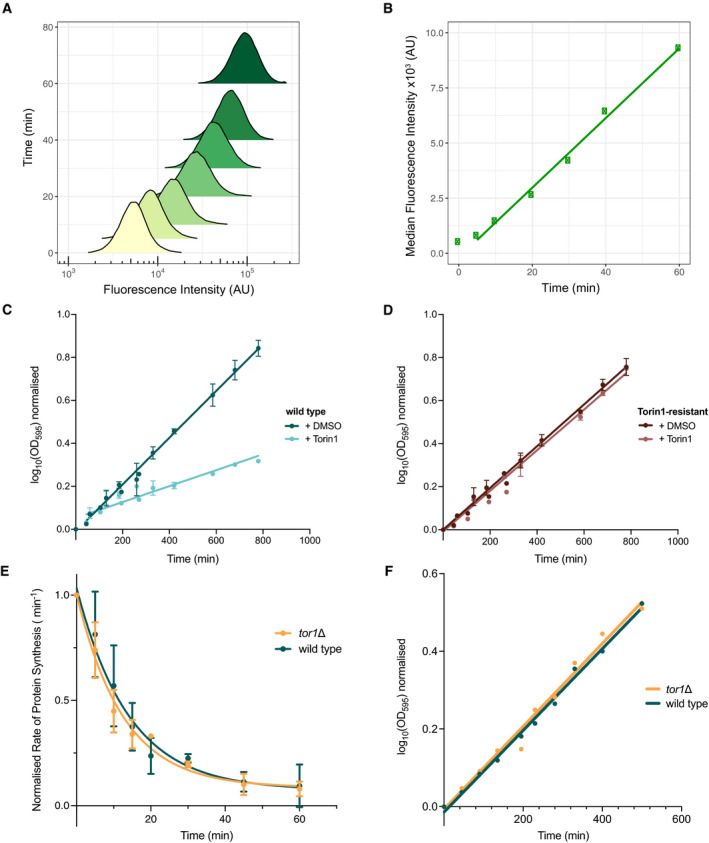
Measuring active protein synthesis using the methionine analogue, L‐homopropargylglycine (HPG) and measuring the change in rates of mass doubling and protein synthesis upon inhibition of TOR activity.
-
ADensity plot showing the measured fluorescence intensity distribution of individual cells for each time point after HPG addition. Time is represented on the y‐axis, with the bottom of the distribution plot aligning to the corresponding time point.
-
BMedian fluorescence intensity of the distribution plots in A plotted against the indicated time after HPG addition. Linear regression line fitted from 5 min onwards.
-
C, DGrowth rates as measured by the change in optical density (OD595) over time for wild type (C) and Torin1‐resistant (D) cells upon 5 µM of Torin1 treatment (at T = 0 min). Respective strains were treated with the DMSO vehicle alone to control for potential effects of the solvent on cell growth. Logarithmic values of the OD595 increase are plotted against time in minutes. Data aggregated from three independent experiments with error bars representing the standard deviations (SD). Linear regressions were fitted using the curve‐fitting function on Prism9. Ratios in the rate of mass doubling (as calculated from gradient of regression lines detailed in Materials and Methods) of Torin1‐treated cells to DMSO control were 0.34 in wild type (C) and 0.97 for Torin1‐resistant (D) cells.
-
ERate of protein synthesis as measured by the amount of HPG incorporation after 20 min of differing time intervals (0–60 min) of 5 µM Torin1 for wild type (green) and tor1∆ (yellow). Values are normalised to T = 0 min. Exponential one‐phase decay non‐linear regressions were fitted using the curve‐fitting function on Prism9. Data aggregated from 3 independent experiments with error bars representing the standard deviations (SD).
-
FGrowth rates for wild type and tor1∆, as measured by the change in optical density (OD595) over time. Linear regressions fitted with Prism9.