
Figure 2. TOR‐dependent phosphoproteomic changes identifies conserved proteins with potential roles in modulating rates of protein synthesis.
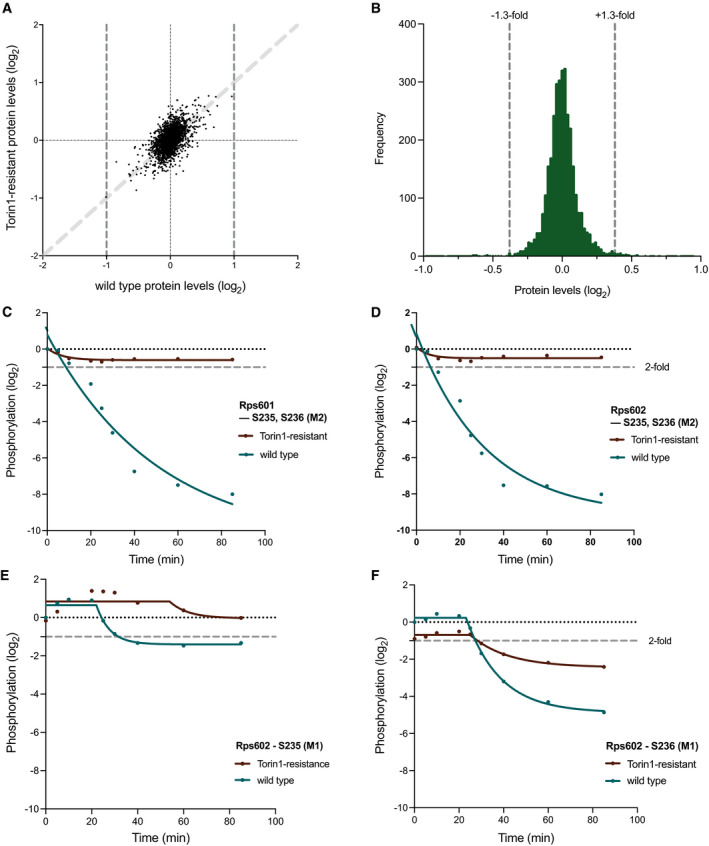
Investigating the protein expression levels for the phosphoproteomics time course study and validation of experimental conditions based on known indirect TOR phosphorylation targets.
-
AScatter plot showing the protein levels in wild type cells after 40 min of Torin1 (5 µM) addition plotted against the corresponding values for the same protein in Torin1‐resistant cells after 40 min. Dark grey dashed lines at x = ±1 indicate the 2‐fold threshold, of which no proteins exceeded in the study. The light grey dashed line represents y = x, plotted as guide to indicate positive correlation in protein levels between wild type and Torin1‐resistant cells.
-
BFrequency distribution of the proteins levels after 40 min of Torin1 treatment in wild type cells (n = 3,380), with 98% of all proteins (3,314/3,380) within a 1.3‐fold boundary, as indicated by the grey dashed lines at ± 0.38.
-
C–FPhosphorylation changes of the conserved phosphosites, S235 and S236, on Rps601(C) and Rps602 (D–F), over 85 min of Torin1 (5 µM) treatment wild type (green) and Torin1‐resistant (brown) cells. M‐values (in brackets) represent the different multiplicities of the same phosphosites. Lines were fitted with the curve‐fitting function on Prism9 using the non‐linear regressions exponential one‐phase decay (C, D) or plateau followed by one‐phase decay (E, F) functions, respectively. Grey dashed lines indicate 2‐fold threshold.