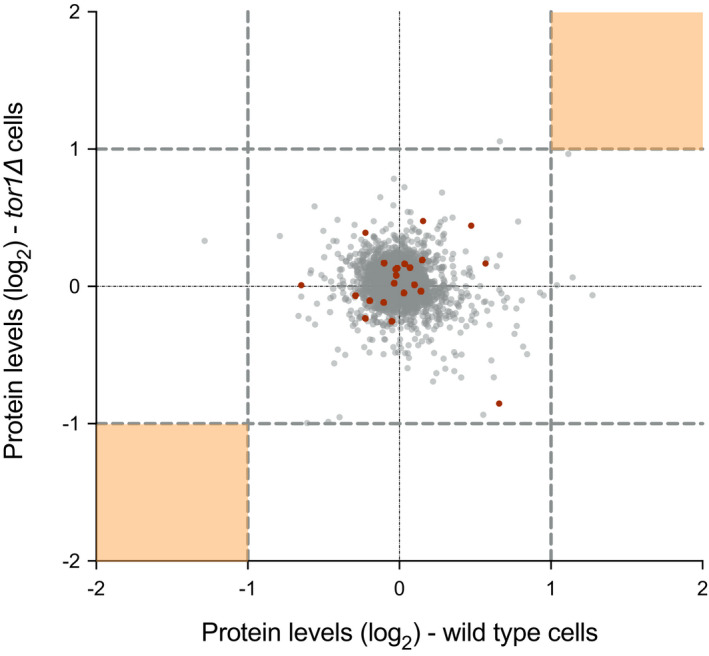
Figure EV2. Relative protein expression levels in wild type and tor1∆ after 40 min of Torin1 treatment.

Scatter plot of the relative expression levels of individual protein in wild type and tor1∆ cells from the 40‐min proteomic time course experiment. Twofold thresholds are represented by grey dashed lines for either direction in the respective strains. Orange shaded areas indicate the expected regions with more than 2‐fold changes in relative protein expression levels in both wild type and tor1∆ cells, of which none were detected in the study. Points highlighted in red indicate the 23 proteins showing over 1.5‐fold difference in expression levels between wild type and tor1∆ before Torin1 treatment. But the relative expression levels of these proteins remain within a 2‐fold range upon inhibition of TOR activity inhibition.
