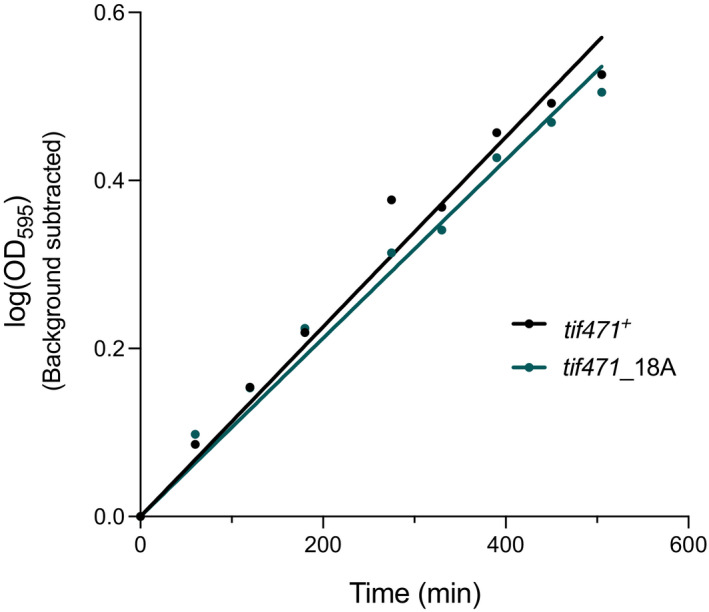
Figure EV3. Relative growth rates in tif471_18A mutant is comparable to wild type cells.

Representative plot of the relative growth rates as measured by the change in optical density (OD595) over time for tif471_18A mutant and control (tif471 +) cells. Values are background subtracted and gradients of the regression lines were 0.0011 for both strains, fitted using simple linear regression on Prism 9.
