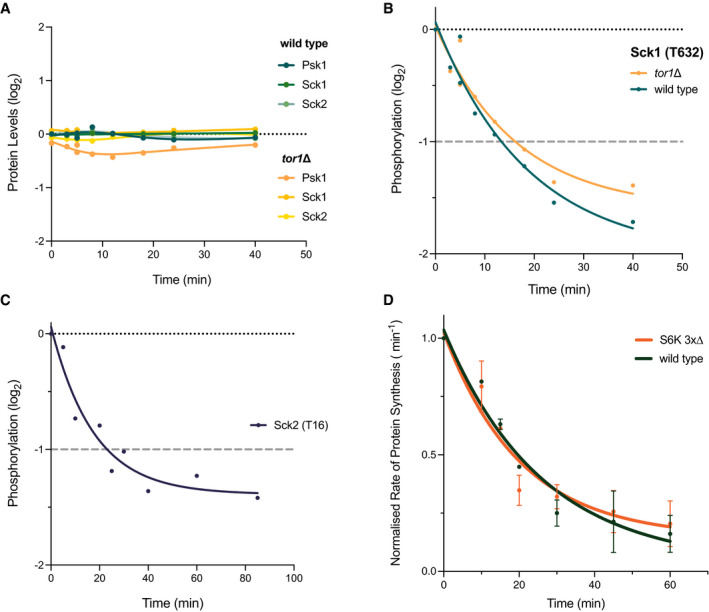
Figure 4. The effects of TOR inhibition on S6K phosphorylation and rates of protein synthesis.

- Relative protein expression levels of the 3 S6 kinase homologues, Psk1, Sck1 and Sck2, plotted against time of Torin1 addition. Respective proteins are represented by the different coloured lines as detailed in the legend.
- Relative phosphorylation level of the T632 phosphosite identified on Sck1 in the 40‐min time course study. Phosphorylation levels of both wild type (green) and tor1∆ (yellow) are presented relative to the value for wild type cells at T = 0 min. Grey dashed line indicates 2‐fold threshold.
- Relative phosphorylation of the T16 phosphosite identified on Sck2 in the 85‐min time course study (background adjusted detailed in Materials and Methods). Grey dashed line indicates 2‐fold threshold.
- Changes in the rates of protein synthesis upon Torin1 treatment (5 µM) measured for wild type and the S6 kinase deletion mutant (S6K 3x∆) plotted over time. Non‐linear regression exponential decay lines were fitted using the curve‐fitting function on Prism9. Error bars represent the standard deviation (SD) of data aggregated from 3 independent experiments.
