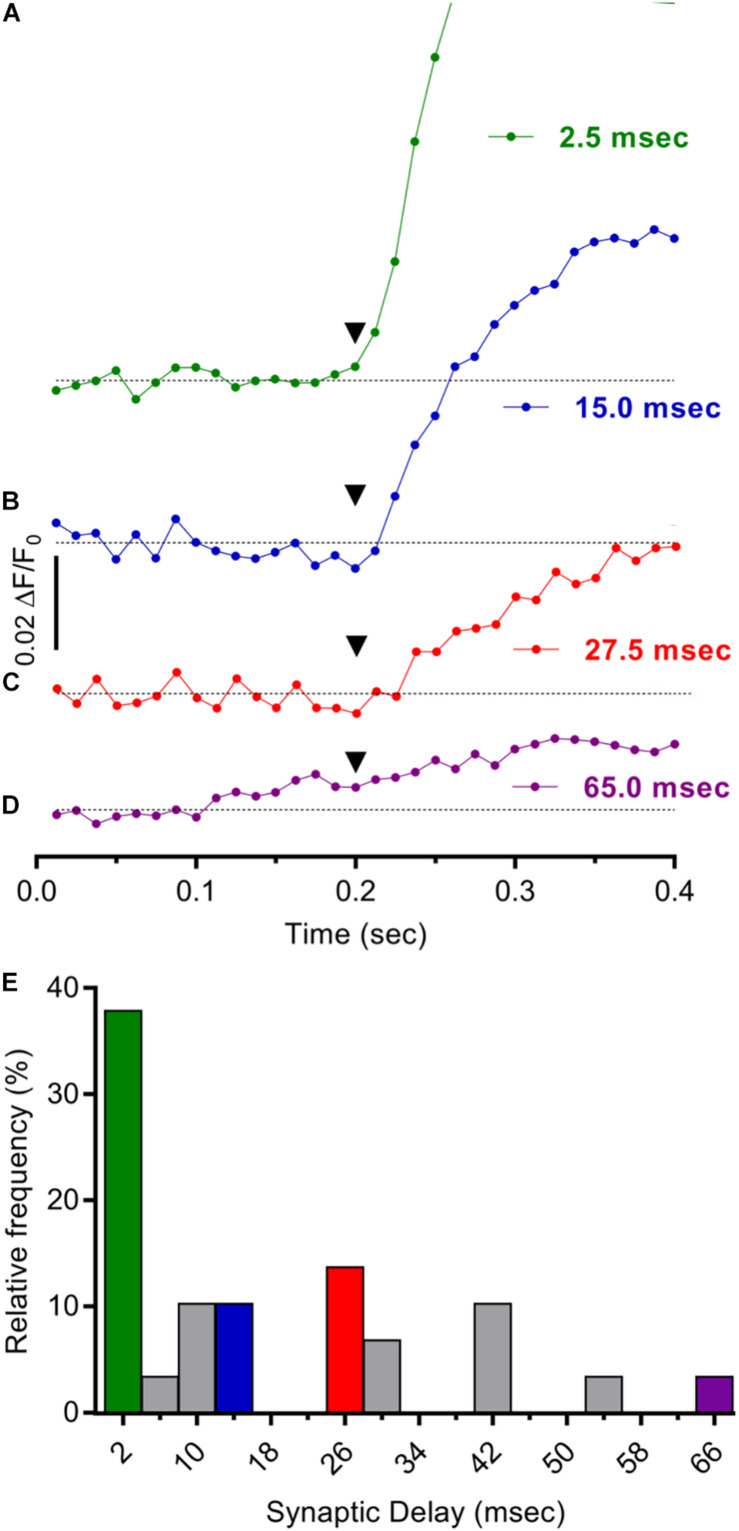
FIGURE 5.
Mono- and poly-synaptic pathways underlie stimulus evoked Ca2+ responses in cholinergic MG neurons. (A–D). Individual records depicting expanded time courses of Ca2+ fluorescence changes sampled at 80 Hz in four GCaMP6f+/ChAT+ neurons from a MG following one 1500 μA stimulus. The time elapsed from stimulus application (inverted black triangles at 200 ms) to response onset [2× SD of pre-stimulus ΔF/F0 (response latency)] was determined for each neuron as described in the text. Synaptic delay times were calculated by subtracting the time required for impulse conduction to the recording site [based on a conduction velocity of 0.55 mm/ms (Stebbing and Bornstein, 1996)] from the response latency and were on average 17.7 ± 3.3 ms (n = 29; N = 2) and 1.5, 15.0, 27.5, and 65.0 ms, respectively, for the neurons depicted in (A–D). (E) Consistent with the prevalence of monosynaptic inputs, synaptic delay times <4 ms were most common. Histogram depicts the frequency distribution of synaptic delay times for 29 neurons with colors matching records in (A–D). Note that the largest fraction of the entries (38%) correspond to synaptic delay times <4 ms while only 10, 7, and 3% correspond to 15, 27, and 65 ms synaptic delay times, respectively.

