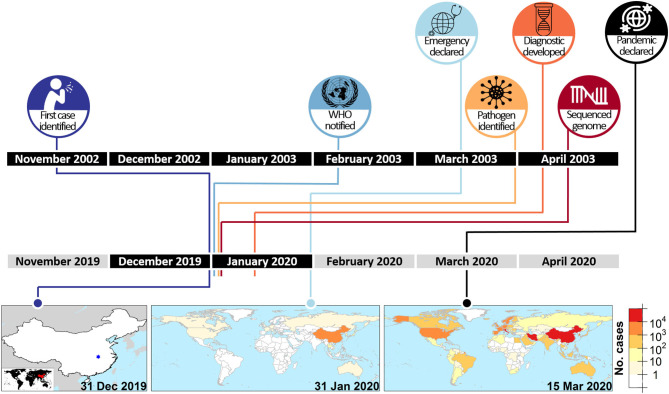
Figure 1.
Comparative timelines of two coronavirus epidemics. The relative timelines for SARS-CoV epidemic of 2002–2003 (top row) (14–19) and SARS-CoV-2 pandemic of 2019 (bottom row) (20–22), specifically highlighting dramatic differences in duration to notification of the WHO, identification of the pathogen and sequencing of the pathogen genome after the identification of the first case. The maps show the spatial extent of SARS-CoV-2 infection at three critical time points (23, 24).

