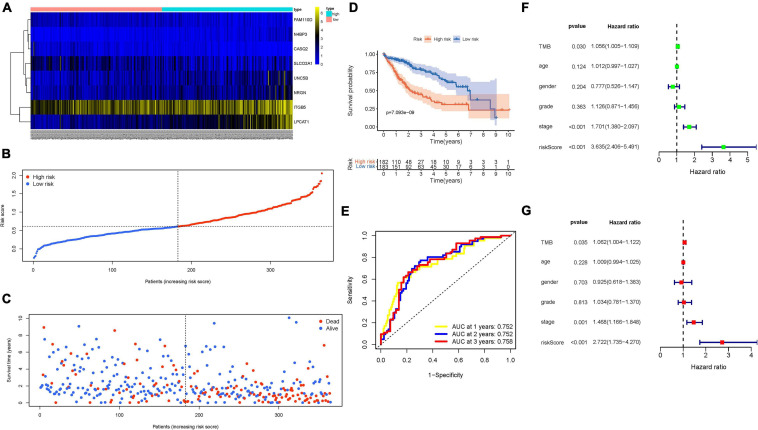
FIGURE 4.
Validation of the prognostic value of risk signature. (A) Heatmap presents the expression pattern of three hub genes in each patient, where the colors of yellow to blue represent alterations from high expression to low expression. (B) Distribution of multi-genes signature risk score. (C) The survival status and interval of HCC patients. (D) Kaplan–Meier curve analysis presenting difference of overall survival between the high-risk and low-risk groups. (E) Areas under curves (AUCs) of the risk scores for predicting 1-, 2-, and 3-year overall survival time. (F) Univariate Cox regression analyses of overall survival. (G) Multivariate Cox regression analyses of overall survival.

