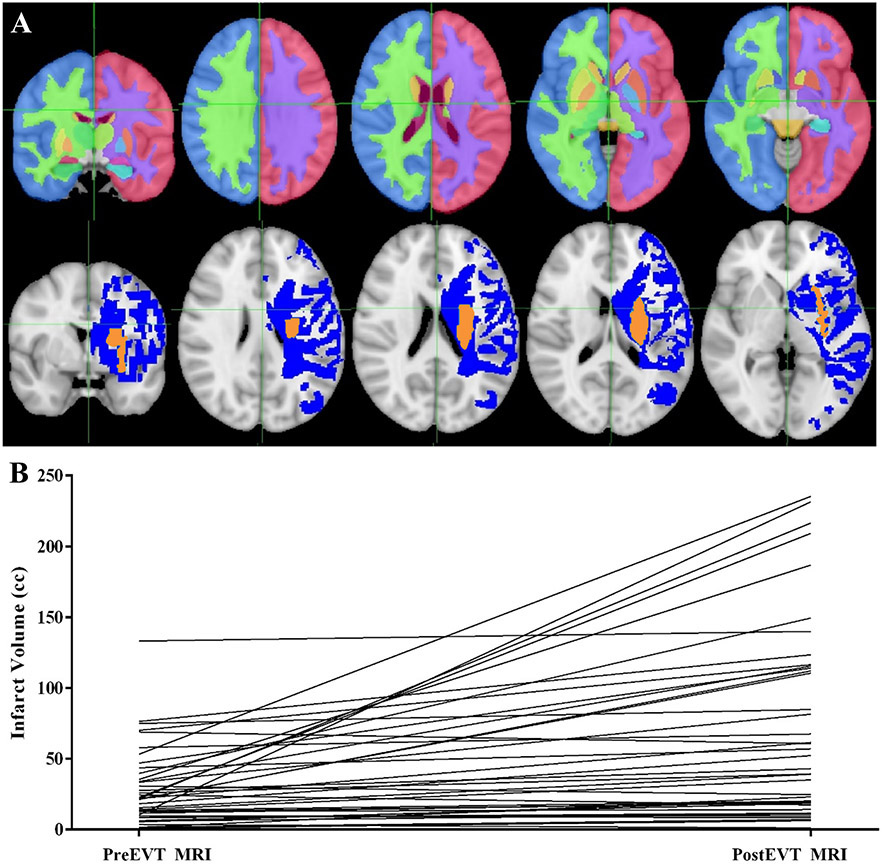
Figure 1.
Region specific infarct growth after endovascular thrombectomy (EVT) despite adequate reperfusion. Panel A: Top row shows sections through Harvard-Oxford subcortical atlas, demonstrating white matter, cortex, and basal ganglia regions, overlaid on MNI 152 standard brain. Bottom row shows sections through a single as a patient representative example of an infarct that grew from pre-EVT (orange) to post-EVT (blue) overlaid on MNI 152 standard brain. Panel B: Change in infarct volume for individual patients from pre-EVT to post-EVT.

