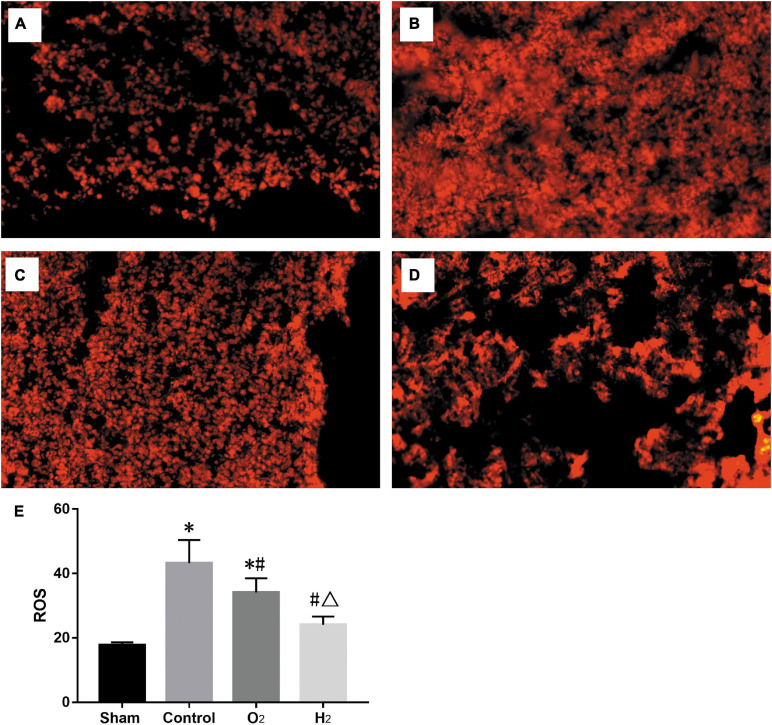
FIGURE 4.
The ROS stained with dihydroethidium imaged by fluorescence microscope. (n = 3, original magnification, 20) (A) sham group; (B) control group; (C) O2 group; (D) H2 group; (E) the ROS levels in lung grafts. The ROS level in the control group was higher than the sham group (P < 0.05), the ROS levels in the O2 and H2 group were lower than the control group (P < 0.05), the H2 group was lower than the O2 group (P < 0.05). ∗P < 0.05 vs. sham group; #P < 0.05 vs. control group; △P < 0.05 vs. O2 group.

