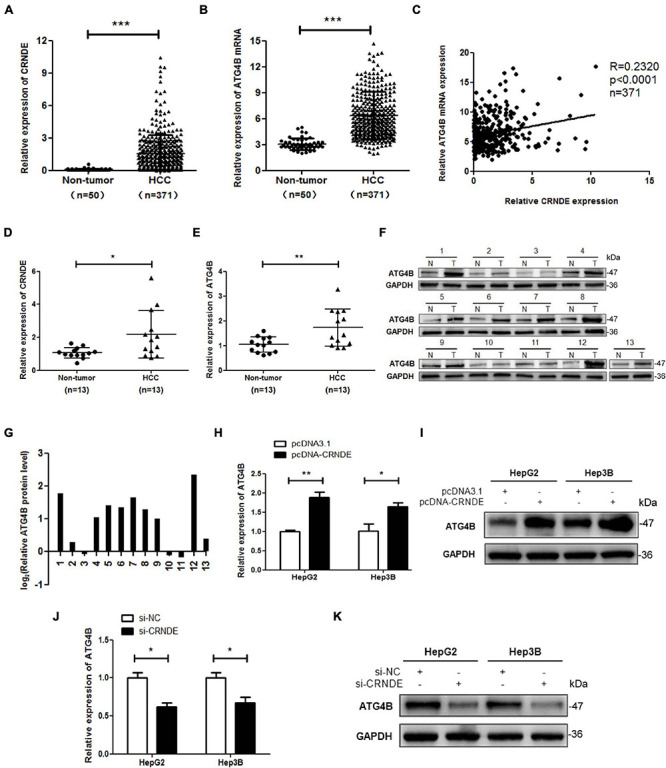
FIGURE 1.

CRNDE elevates ATG4B in HCC cells. (A,B) Expression analysis of CRNDE and ATG4B in HCC tissues and non-cancerous liver tissues using TCGA database. (C) Analysis of the correlation between CRNDE and ATG4B mRNA levels in HCC tissues using TCGA database. (D–F) The levels of CRNDE, ATG4B mRNA and protein in 13 pairs of HCC tissues (T) and the adjacent non-cancerous liver tissues (N) were separately assayed by qPCR (D,E) and Western blot (F). (G) The protein band density in F was analyzed using Image Lab software and the relative ATG4B protein level (ATG4B/GAPDH ratio) was transformed to Log2 (T/N). (H–K) HepG2 and Hep3B cells were transfected with pcDNA-CRNDE (or pcDNA3.1) (H,I) or si-CRNDE (or si-NC) (J,K) for 24 h, then the levels of ATG4B mRNA and protein were separately detected by qPCR (H,J) and Western blot (I,K). pcDNA-CRNDE: CRNDE expression vector; pcDNA3.1: control vector pcDNA3.1(+); si-CRNDE: the siRNA for CRNDE; si-NC: control siRNA; *P < 0.05; **P < 0.01; ***P < 0.001.
