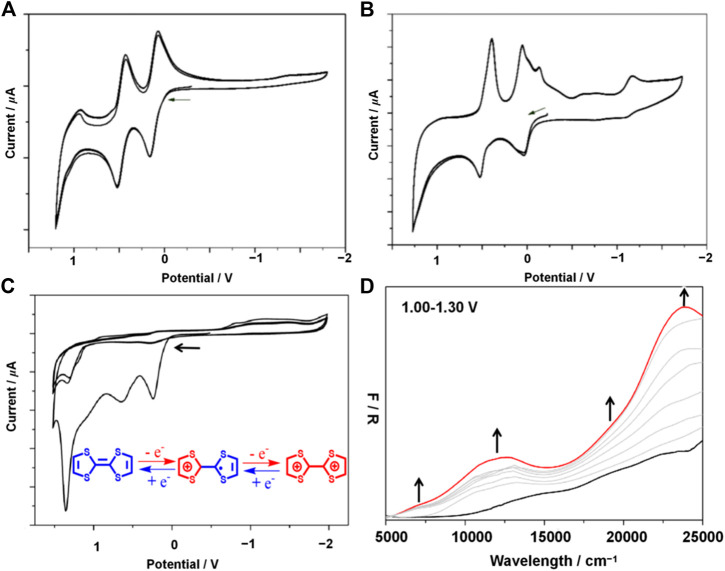
FIGURE 3.
Solution state CVs of H2L measured over 3 consecutive sweeps (A), solution state CVs of [FeⅡL(CH3OH)2] measured over 3 consecutive sweeps (B), solid state CV for 1 obtained at 100 mVs−1 over 3 consecutive scans (C), solid-state UV-vis-NIR spectroelectrochemistry of 1 at 0 V (black) and 1.30 V (red) (D). Gray spectra correspond to the spectral transition over the applied potential range of 1.00–1.30 V. Experiment performed in 0.1 mol L−1 TBAPF6 in CH2Cl2. Arrows denote the direction of forward scan.

