
FIGURE 10.
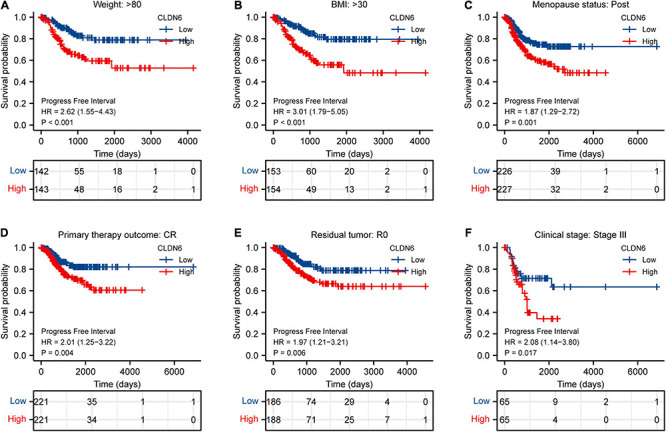
Associations between CLDN6 expression and the PFI in different clinical subgroups of UCEC. (A) Weight > 80; (B) BMI > 30; (C) postmenopause; (D) primary therapy outcome (CR); (E) residual tumor (R0); (F) stage III.
Official websites use .gov
A
.gov website belongs to an official
government organization in the United States.
Secure .gov websites use HTTPS
A lock (
) or https:// means you've safely
connected to the .gov website. Share sensitive
information only on official, secure websites.
Associations between CLDN6 expression and the PFI in different clinical subgroups of UCEC. (A) Weight > 80; (B) BMI > 30; (C) postmenopause; (D) primary therapy outcome (CR); (E) residual tumor (R0); (F) stage III.