FIGURE 12.

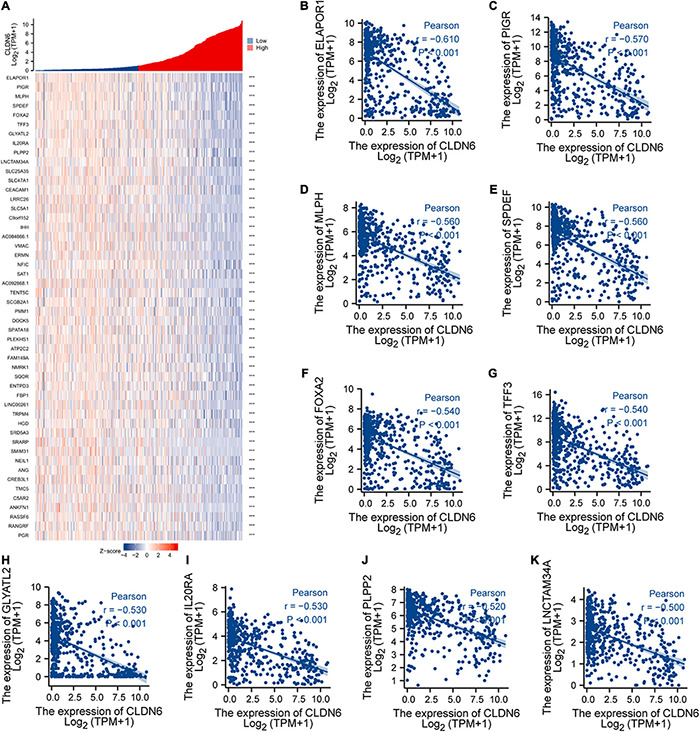
Top 50 genes negatively correlated with CLDN6 expression in UCEC. (A) The gene co-expression heatmap of the top 50 genes negatively correlated with CLDN6 in UCEC; (B–K) correlation analysis of the top 10 genes and CLDN6 in the heatmap.

Top 50 genes negatively correlated with CLDN6 expression in UCEC. (A) The gene co-expression heatmap of the top 50 genes negatively correlated with CLDN6 in UCEC; (B–K) correlation analysis of the top 10 genes and CLDN6 in the heatmap.