FIGURE 3.

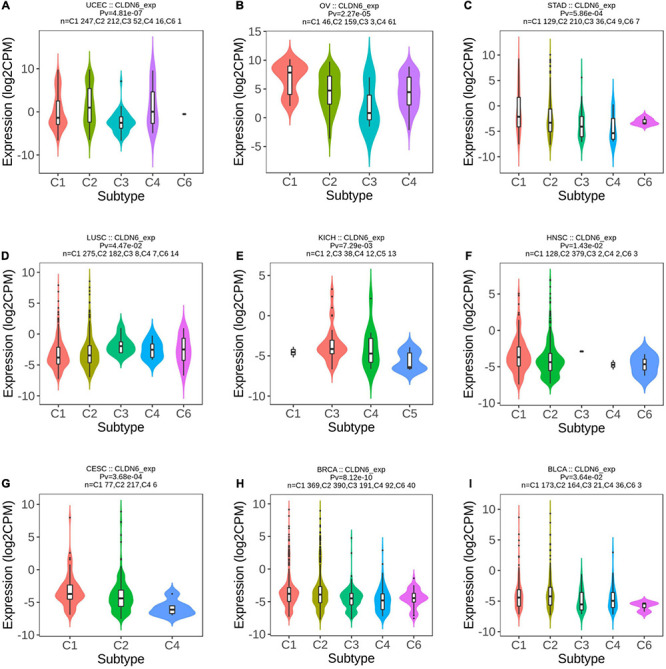
Correlations between CLDN6 expression and immune subtypes across TCGA tumors. (A) UCEC; (B) OV; (C) STAD; (D) LUSC; (E) KICH; (F) HNSC; (G) CESC; (H) BRCA; (I) BLCA.

Correlations between CLDN6 expression and immune subtypes across TCGA tumors. (A) UCEC; (B) OV; (C) STAD; (D) LUSC; (E) KICH; (F) HNSC; (G) CESC; (H) BRCA; (I) BLCA.