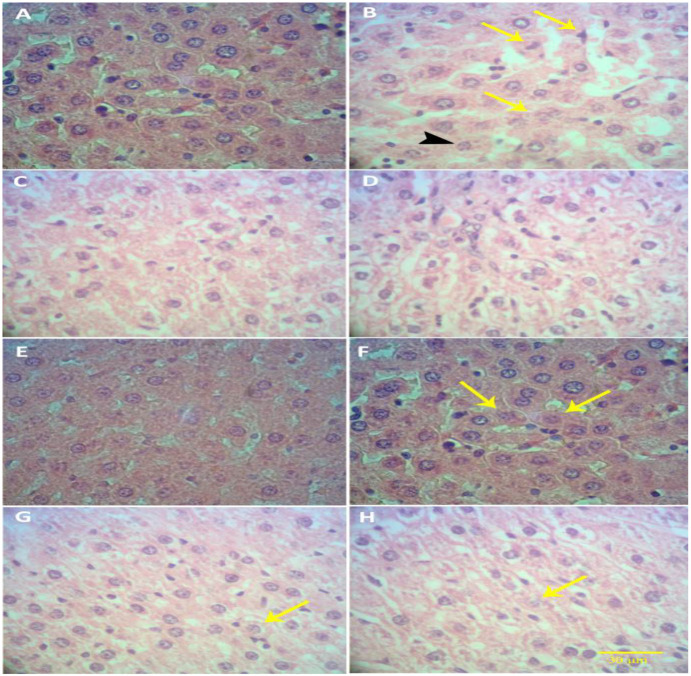
Figure 2.
Optical photomicrograph of liver tissue- A: In the control group, the normal structure of liver tissue is observed. B: In the Ethanol30 group, necrosis (yellow arrows), karyorrhexis (black arrowhead), karyolysis and eosinophilia of the cytoplasm are observed. Liver tissue is destroyed. C, D and E: In groups CUR100, UDCA20 and CUR100+UDCA20, liver tissue and hepatocytes are normal. F and G: In the groups of Ethanol30+CUR100 and Ethanol30+UDCA20, cell necrosis (yellow arrows) and hepatocyte hyperemia are reduced and liver tissue destruction is mild. H: In the Ethanol30+CUR100+UDCA20 group, a very mild necrosis (yellow arrow) is observed and structural changes in liver tissue are very minor. Liver tissue is improved. (E&H staining, 40X; bar: 30 µm)

