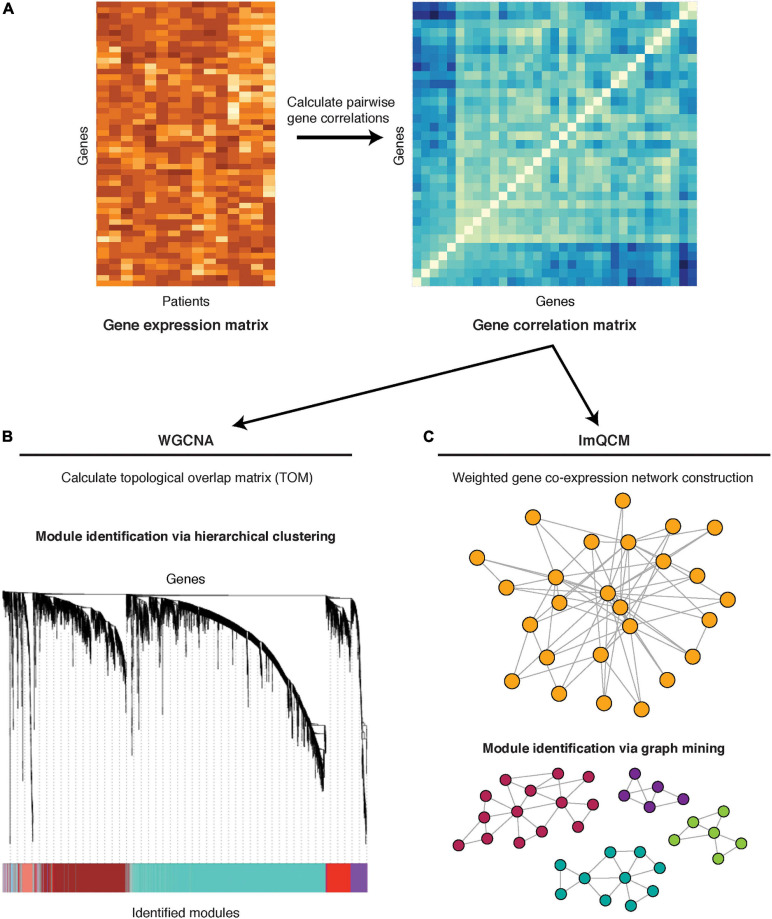
FIGURE 2.
Co-expression network methods: WGNCA and lmQCM. (A) Pairwise gene correlations are calculated from gene expression (microarray or RNA-seq) data. (B) The co-expression matrix is transformed into a topological overlap matrix and subjected to hierarchical clustering for module identification. A cluster dendrogram is shown, with different gene modules identified by the color bar on the bottom. (C) The co-expression matrix is used to construct a network, with genes as nodes and the correlation co-efficient between any two genes as the edge weight. Module identification is achieved through a greedy search for highly correlated subnetworks.

